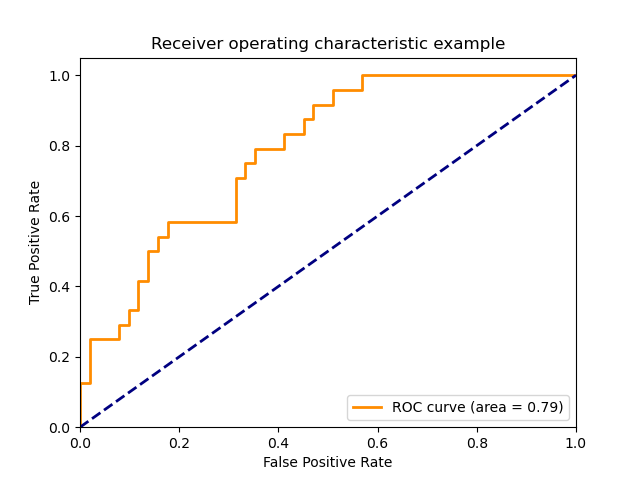
sklearn.metrics.roc_curve
sklearn.metrics.roc_curve(y_true, y_score, *, pos_label=None, sample_weight=None, drop_intermediate=True)
计算接收器工作特性(ROC)
注意:此实现仅限于二进制分类任务。
在用户指南中阅读更多内容。
| 参数 | 说明 |
|---|---|
| y_true | array, shape = [n_samples] 真正的二进制标签。 如果标签既不是{-1,1}也不是{0,1},则应该明确给出pos_label。 |
| y_score | array, shape = [n_samples] 目标分数可以是正例类的概率估计值,置信度值或决策的非阈值度量(如某些分类器上的“ decision_function”所返回)。 |
| pos_label | int or str, default=None 正例类的标签。当pos_label = None时,如果y_true在{-1,1}或{0,1}中,则pos_label设置为1,否则将引发错误。 |
| sample_weight | array-like of shape (n_samples,), default=None 样本权重。 |
| drop_intermediate | boolean, optional (default=True) 是否降低一些未达到最佳阈值的阈值,这些阈值不会出现在绘制的ROC曲线上。 这对于创建较浅的ROC曲线很有用。 版本0.17中的新功能:参数drop_intermediate。 |
| 返回值 | 说明 |
|---|---|
| fpr | array, shape = [>2] 增加假正例率,使得元素i是score >= thresholds[i]预测的假正例率。 |
| tpr | array, shape = [>2] 增加真正例率,使得元素i是score >= thresholds[i]的预测的真正例率。 |
| thresholds | array, shape = [n_thresholds] 用于计算fpr和tpr的决策函数的阈值递减。 thresholds [0]表示没有实例在预测中,可以任意设置为max(y_score)+ 1。 |
另见:
计算ROC曲线下的面积
注
由于阈值从低到高排序,返回时将它们反转以确保它们对应于fpr和tpr(它们在计算过程中按相反的顺序排序)。
参考
1 Wikipedia entry for the Receiver operating characteristic
2 Fawcett T. An introduction to ROC analysis[J]. Pattern Recognition Letters, 2006, 27(8):861-874.
示例
>>> import numpy as np
>>> from sklearn import metrics
>>> y = np.array([1, 1, 2, 2])
>>> scores = np.array([0.1, 0.4, 0.35, 0.8])
>>> fpr, tpr, thresholds = metrics.roc_curve(y, scores, pos_label=2)
>>> fpr
array([0. , 0. , 0.5, 0.5, 1. ])
>>> tpr
array([0. , 0.5, 0.5, 1. , 1. ])
>>> thresholds
array([1.8 , 0.8 , 0.4 , 0.35, 0.1 ])

