

绘制随机生成的分类数据集
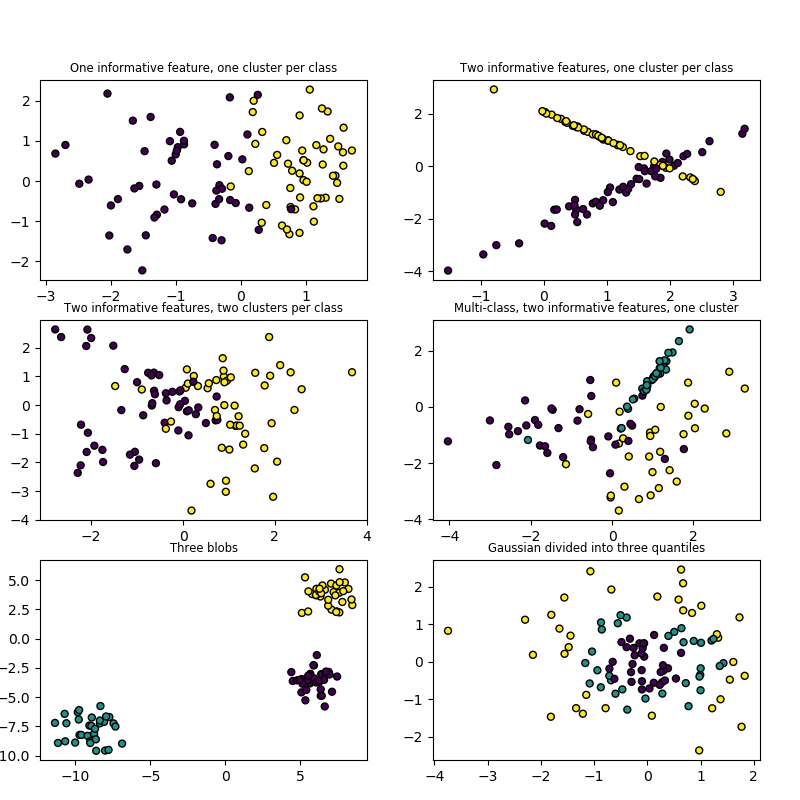
此示例绘制了几个随机生成的分类数据集。为了便于可视化,所有数据集都有两个特征,绘制在x和y轴上。每个点的颜色表示其类标签。
前4幅图使用 make_classification,有不同数量的信息特征、类的数量和类的聚类量。最后两幅图使用make_blobs和make_gaussian_quantiles。
print(__doc__)

import matplotlib.pyplot as plt

from sklearn.datasets import make_classification
from sklearn.datasets import make_blobs
from sklearn.datasets import make_gaussian_quantiles

plt.figure(figsize=(8, 8))
plt.subplots_adjust(bottom=.05, top=.9, left=.05, right=.95)

plt.subplot(321)
plt.title("One informative feature, one cluster per class", fontsize='small')
X1, Y1 = make_classification(n_features=2, n_redundant=0, n_informative=1,
                             n_clusters_per_class=1)
plt.scatter(X1[:, 0], X1[:, 1], marker='o', c=Y1,
            s=25, edgecolor='k')

plt.subplot(322)
plt.title("Two informative features, one cluster per class", fontsize='small')
X1, Y1 = make_classification(n_features=2, n_redundant=0, n_informative=2,
                             n_clusters_per_class=1)
plt.scatter(X1[:, 0], X1[:, 1], marker='o', c=Y1,
            s=25, edgecolor='k')

plt.subplot(323)
plt.title("Two informative features, two clusters per class",
          fontsize='small')
X2, Y2 = make_classification(n_features=2, n_redundant=0, n_informative=2)
plt.scatter(X2[:, 0], X2[:, 1], marker='o', c=Y2,
            s=25, edgecolor='k')

plt.subplot(324)
plt.title("Multi-class, two informative features, one cluster",
          fontsize='small')
X1, Y1 = make_classification(n_features=2, n_redundant=0, n_informative=2,
                             n_clusters_per_class=1, n_classes=3)
plt.scatter(X1[:, 0], X1[:, 1], marker='o', c=Y1,
            s=25, edgecolor='k')

plt.subplot(325)
plt.title("Three blobs", fontsize='small')
X1, Y1 = make_blobs(n_features=2, centers=3)
plt.scatter(X1[:, 0], X1[:, 1], marker='o', c=Y1,
            s=25, edgecolor='k')

plt.subplot(326)
plt.title("Gaussian divided into three quantiles", fontsize='small')
X1, Y1 = make_gaussian_quantiles(n_features=2, n_classes=3)
plt.scatter(X1[:, 0], X1[:, 1], marker='o', c=Y1,
            s=25, edgecolor='k')

plt.show()
脚本的总运行时间:(0分0.337秒)

