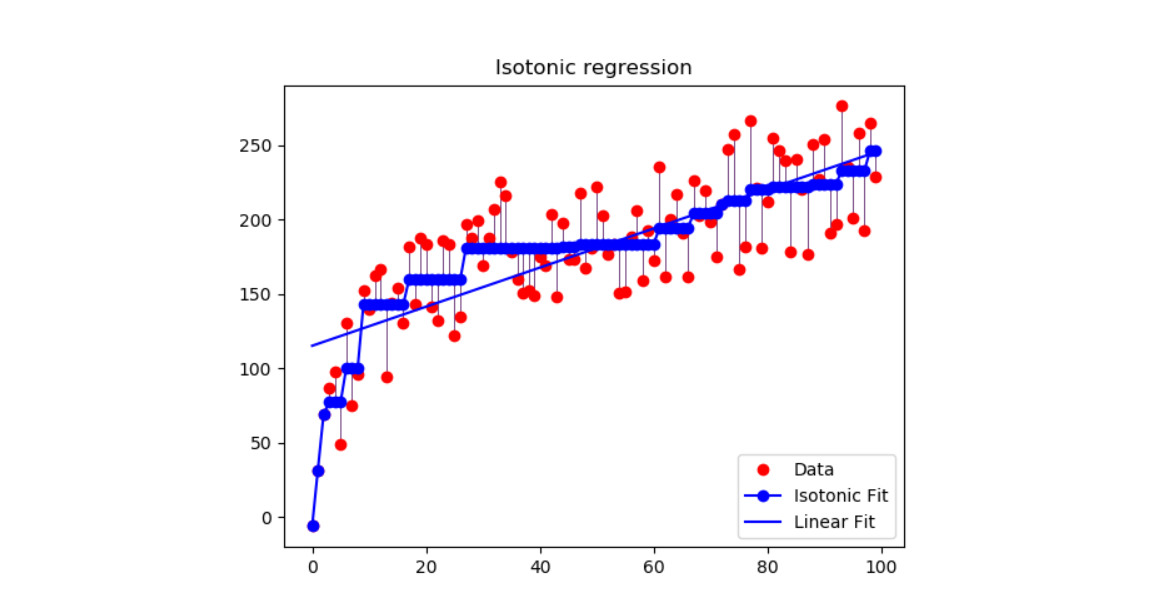
sklearn.isotonic.IsotonicRegression
阅读更多内容用户指南.
新版本0.13。
| 参数 | 说明 |
|---|---|
| y_min | float, default=None 最低预测值的下限(最小值可能更高)。如果没有设置,默认为-inf。 |
| y_max | float, default=None 最高预测值的上限(最大值可能仍然较低)。如果没有设置,默认为+inf。 |
| increasing | bool or ‘auto’, default=True 确定预测是否应限制为随X增加或减少。“auto”将根据Spearman相关估计的符号来决定。 |
| out_of_bounds | out_of_bounds:str, default=”nan” Out_Of_Bound参数如何处理训练域之外的X值。当设置为“NaN”时,预测将为NaN。当设置为“clip”时,预测将被设置为与最近的训练间隔终点相对应的值。当设置为“raise”时,将引发ValueError。 |
| 属性 | 说明 |
|---|---|
| X_min_ | float 左界输入数组X_的最小值。 |
| X_max_ | float 右界输入数组X_的最大值。 |
| f_ | function 包含输入域X的逐步插值函数。 |
| increasing_ | bool 用于increasing的推断值。 |
注
领带是1977年用Leeuw的第二方法打破的。
参考文献
1 Isotonic Median Regression: A Linear Programming Approach Nilotpal Chakravarti Mathematics of Operations Research Vol. 14, No. 2 (May, 1989), pp. 303-308
2 Isotone Optimization in R : Pool-Adjacent-Violators Algorithm (PAVA) and Active Set Methods Leeuw, Hornik, Mair Journal of Statistical Software 2009
3 Correctness of Kruskal’s algorithms for monotone regression with ties Leeuw, Psychometrica, 1977
实例
>>> from sklearn.datasets import make_regression
>>> from sklearn.isotonic import IsotonicRegression
>>> X, y = make_regression(n_samples=10, n_features=1, random_state=41)
>>> iso_reg = IsotonicRegression().fit(X.flatten(), y)
>>> iso_reg.predict([.1, .2])
array([1.8628..., 3.7256...])
方法
| 方法 | 说明 |
|---|---|
fit(self, X, y[, sample_weight]) |
以X,y作为训练数据对模型进行拟合。 |
fit_transform(self, X[, y]) |
适合数据,然后对其进行转换。 |
get_params(self[, deep]) |
获取此估计器的参数。 |
predict(self, T) |
用线性插值预测新数据。 |
score(self, X, y[, sample_weight]) |
返回预测的决定系数R^2。 |
set_params(self, **params) |
设置此估计器的参数。 |
transform(self, T) |
用线性插值变换新数据 |
__init__(self, *, y_min=None, y_max=None, increasing=True, out_of_bounds='nan')
[源码]
初始化self, 请参阅help(type(self))以获得准确的说明
fit(self, X, y, sample_weight=None)
[源码]
以X,y作为训练数据对模型进行拟合。
| 参数 | 说明 |
|---|---|
| X | array-like of shape (n_samples,) 培训数据。 |
| y | array-like of shape (n_samples,) 训练目标。 |
| sample_weight | array-like of shape (n_samples,), default=None 权重。如果设置为“无”,则所有权重将设置为1(相同的权重)。 |
| 返回值 | 说明 |
|---|---|
| self | object 返回Self的实例。 |
注
因为转换需要X来插值新的输入数据,所以X被存储以供将来使用。
fit_transform(self, X, y=None, fit_params)
拟合数据,然后对其进行转换。
使用可选参数fit_params将转换器拟合到X和y,并返回X的转换版本。
| 参数 | 说明 |
|---|---|
| X | {array-like, sparse matrix, dataframe} of shape (n_samples, n_features) |
| Y | ndarray of shape (n_samples,), default=None 目标值。 |
| **fit_params | dict 其他拟合参数。 |
| 返回值 | 说明 |
|---|---|
| X_new | ndarray array of shape (n_samples, n_features_new) 变换数组 |
get_params(self, deep=True)
[源码]
获取此估计量的参数。
| 参数 | 说明 |
|---|---|
| deep | bool, default=True 如果为True,则将返回此估计器的参数和包含的子对象,这些子对象是估计量。 |
| 返回值 | 说明 |
|---|---|
| params | mapping of string to any 映射到其值的参数名称。 |
predict(self, T)
[源码]
用线性插值预测新数据。
| 参数 | 说明 |
|---|---|
| T | array-like of shape (n_samples,) 要转换的数据。 |
| 返回值 | 说明 |
|---|---|
| Y_pred | ndarray of shape (n_samples,) 转换数据。 |
score(self, X, y, sample_weight=None)
[源码]
返回预测的决定系数R^2。
系数R^2定义为(1-u/v),其中u是平方的残差和((y_true-y_pred)2).sum(),v是平方和总和((y_true-y_true.means())2).sum()。最高得分可能为1.0,也可能为负(因为该模型可能会更差)。如果常量模型总是预测y的期望值,而不考虑输入特征,R^2则会得到分数0.0。
| 参数 | 说明 |
|---|---|
| X | array-like of shape (n_samples, n_features) 测试样本。对于某些估计量,这可能是一个预先计算的核矩阵或一个泛型对象的列表,即form=(n_sames,n_sames_拟合),其中n_sames_拟合是用于拟合估计器的样本数。 |
| Y | array-like of shape (n_samples,) or (n_samples, n_outputs) X的真值。 |
| sample_weight | array-like of shape (n_samples,), default=None 样本权重 |
| 返回值 | 说明 |
|---|---|
| score | float 自身的R^2,预测(X)WRT.Y. |
注
在回归器上调用分数时使用的R2分数使用版本0.23中的multioutput=‘CONFORMAL_Average’,以与默认值R2_SCORE保持一致。这会影响所有多输出回归变量的评分方法(MultiOutputRegressor除外)。
set_params(self, params)
[源码]
设置此估计量的参数。
该方法适用于简单估计量以及嵌套对象(例如pipelines)。后者具有形式的参数。<component>__<parameter>这样就可以更新嵌套对象的每个组件。
| 参数 | 说明 |
|---|---|
| params | dict 估计参数 |
| 返回值 | 说明 |
|---|---|
| self | object 估计实例 |
transform(self, T)
[源码]
用线性插值变换新数据
| 参数 | 说明 |
|---|---|
| T | array-like of shape (n_samples,) 要转换的数据。 |
| 返回值 | 说明 |
|---|---|
| y_pred | ndarray of shape (n_samples,) 转换数据 |


