sklearn.metrics.PrecisionRecallDisplay
class sklearn.metrics.PrecisionRecallDisplay(precision, recall, *, average_precision=None, estimator_name=None)
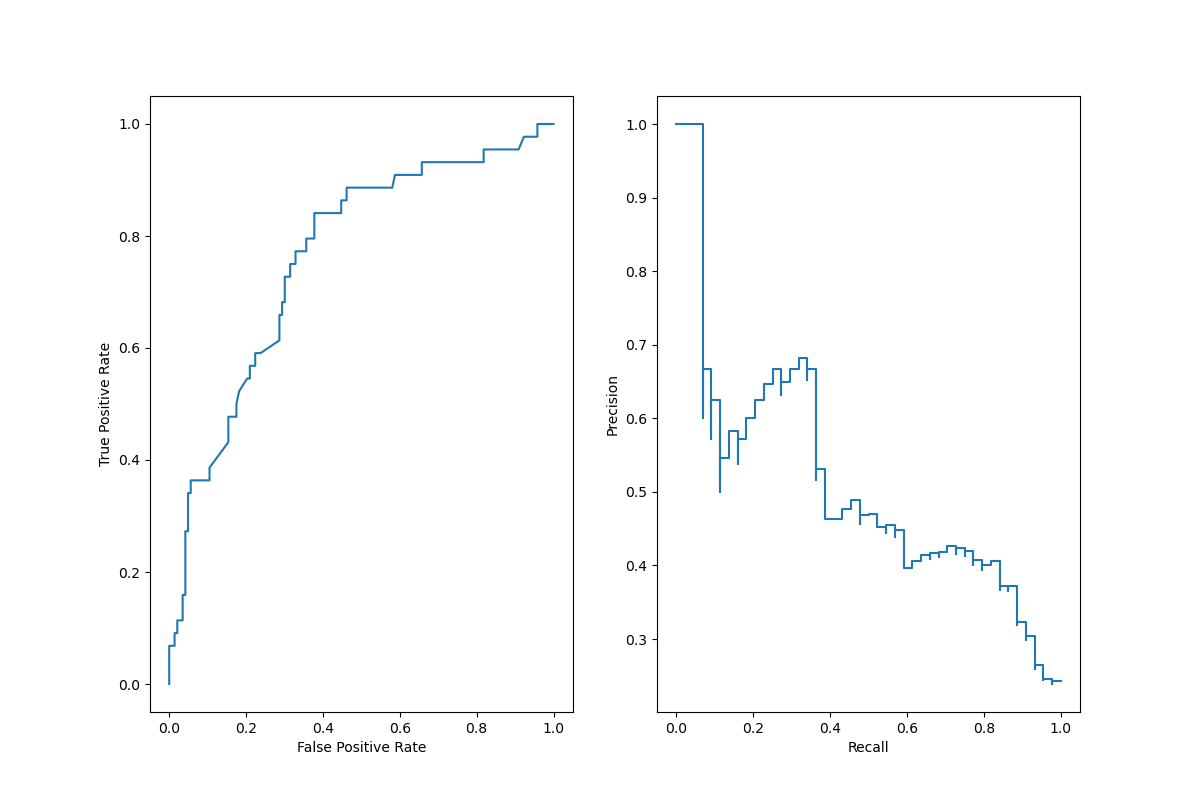
精确调用可视化。
建议使用plot_precision_recall_curve创建可视化器。所有参数都存储为属性。
在用户指南中阅读更多内容。
| 参数 | 说明 |
|---|---|
| precision | ndarray 精度值。 |
| recall | ndarray 调用值。 |
| average_precision | float, default=None 平均精度。如果为None,则不显示平均精度。 |
| estimator_name | str, default=None 估算器名称。 如果为None,则不显示估算器名称。 |
| 属性 | 说明 |
|---|---|
| line_ | matplotlib Artist 精确召回曲线。 |
| ax_ | matplotlib Axes 具有精确召回曲线的轴。 |
| figure_ | matplotlib Figure 包含曲线的图。 |
| 方法 | 说明 |
|---|---|
plot([ax, name]) |
绘图可视化。 |
__init__(precision, recall, *, average_precision=None, estimator_name=None)
自我初始化。有关确切签名,请参见help(type(self))。
plot(ax=None, *, name=None, **kwargs)
绘图可视化。
额外的关键字参数将传递到matplotlib的绘图中。
| 参数 | 说明 |
|---|---|
| ax | Matplotlib Axes, default=None 要绘制的轴对象。如果为None,则将创建新的图形和轴。 |
| name | str, default=None 标记的精确召回曲线的名称。如果为None,请使用估算器的名称。 |
| **kwargs | dict 将传递给matplotlib图的关键字参数。 |
| 返回值 | 说明 |
|---|---|
| display | PrecisionRecallDisplay存储计算值的对象。 |