

k均值初始化影响的实证评价
通过聚类相对标准的inertia(即离最近聚类中心的平方距离之和)来评价 k-means初始化策略的收敛鲁棒性。
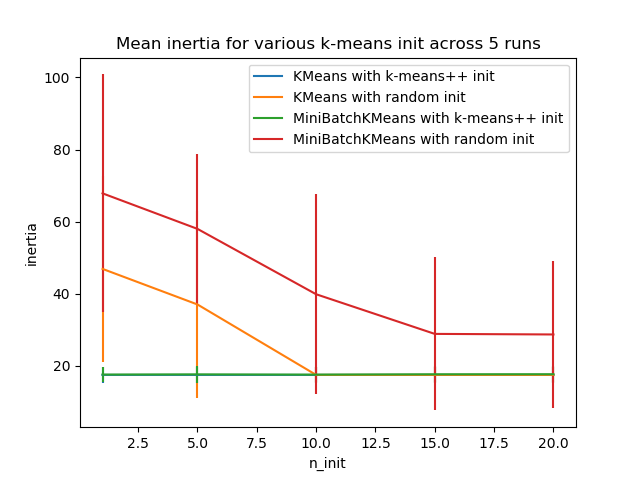
第一个图显示模型(KMeans或MiniBatchKMeans)和init方法(init=“random”或init=“kmeans++”)的每个组合所达到的最佳inertia,增加控制初始化次数的n_init参数的值。
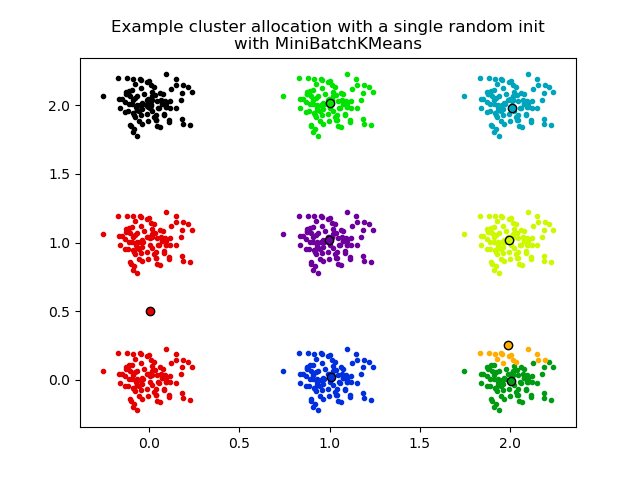
第二幅图演示了使用init="random"和n_init=1的MiniBatchKMeans估计器的单次运行。这种运行导致了一个糟糕的收敛(局部最优),估计中心被困在真正的簇之间。
用于计算的数据集是一个分布广泛的各向同性高斯簇的二维网格。
Evaluation of KMeans with k-means++ init
Evaluation of KMeans with random init
Evaluation of MiniBatchKMeans with k-means++ init
Evaluation of MiniBatchKMeans with random init
print(__doc__)

# Author: Olivier Grisel <olivier.grisel@ensta.org>
# License: BSD 3 clause

import numpy as np
import matplotlib.pyplot as plt
import matplotlib.cm as cm

from sklearn.utils import shuffle
from sklearn.utils import check_random_state
from sklearn.cluster import MiniBatchKMeans
from sklearn.cluster import KMeans

random_state = np.random.RandomState(0)

# Number of run (with randomly generated dataset) for each strategy so as
# to be able to compute an estimate of the standard deviation
n_runs = 5

# k-means models can do several random inits so as to be able to trade
# CPU time for convergence robustness
n_init_range = np.array([1, 5, 10, 15, 20])

# Datasets generation parameters
n_samples_per_center = 100
grid_size = 3
scale = 0.1
n_clusters = grid_size ** 2


def make_data(random_state, n_samples_per_center, grid_size, scale):
    random_state = check_random_state(random_state)
    centers = np.array([[i, j]
                        for i in range(grid_size)
                        for j in range(grid_size)])
    n_clusters_true, n_features = centers.shape

    noise = random_state.normal(
        scale=scale, size=(n_samples_per_center, centers.shape[1]))

    X = np.concatenate([c + noise for c in centers])
    y = np.concatenate([[i] * n_samples_per_center
                        for i in range(n_clusters_true)])
    return shuffle(X, y, random_state=random_state)

# Part 1: Quantitative evaluation of various init methods

plt.figure()
plots = []
legends = []

cases = [
    (KMeans, 'k-means++', {}),
    (KMeans, 'random', {}),
    (MiniBatchKMeans, 'k-means++', {'max_no_improvement': 3}),
    (MiniBatchKMeans, 'random', {'max_no_improvement': 3, 'init_size': 500}),
]

for factory, init, params in cases:
    print("Evaluation of %s with %s init" % (factory.__name__, init))
    inertia = np.empty((len(n_init_range), n_runs))

    for run_id in range(n_runs):
        X, y = make_data(run_id, n_samples_per_center, grid_size, scale)
        for i, n_init in enumerate(n_init_range):
            km = factory(n_clusters=n_clusters, init=init, random_state=run_id,
                         n_init=n_init, **params).fit(X)
            inertia[i, run_id] = km.inertia_
    p = plt.errorbar(n_init_range, inertia.mean(axis=1), inertia.std(axis=1))
    plots.append(p[0])
    legends.append("%s with %s init" % (factory.__name__, init))

plt.xlabel('n_init')
plt.ylabel('inertia')
plt.legend(plots, legends)
plt.title("Mean inertia for various k-means init across %d runs" % n_runs)

# Part 2: Qualitative visual inspection of the convergence

X, y = make_data(random_state, n_samples_per_center, grid_size, scale)
km = MiniBatchKMeans(n_clusters=n_clusters, init='random', n_init=1,
                     random_state=random_state).fit(X)

plt.figure()
for k in range(n_clusters):
    my_members = km.labels_ == k
    color = cm.nipy_spectral(float(k) / n_clusters, 1)
    plt.plot(X[my_members, 0], X[my_members, 1], 'o', marker='.', c=color)
    cluster_center = km.cluster_centers_[k]
    plt.plot(cluster_center[0], cluster_center[1], 'o',
             markerfacecolor=color, markeredgecolor='k', markersize=6)
    plt.title("Example cluster allocation with a single random init\n"
              "with MiniBatchKMeans")

plt.show()
脚本的总运行时间:(0分3.582秒)
Download Python source code:plot_kmeans_stability_low_dim_dense.py
Download Jupyter notebook:plot_kmeans_stability_low_dim_dense.ipynb

