

聚类表现评估中的机会调整
下面的图表演示了聚类数量和样本数量对各种聚类性能评估指标的影响。
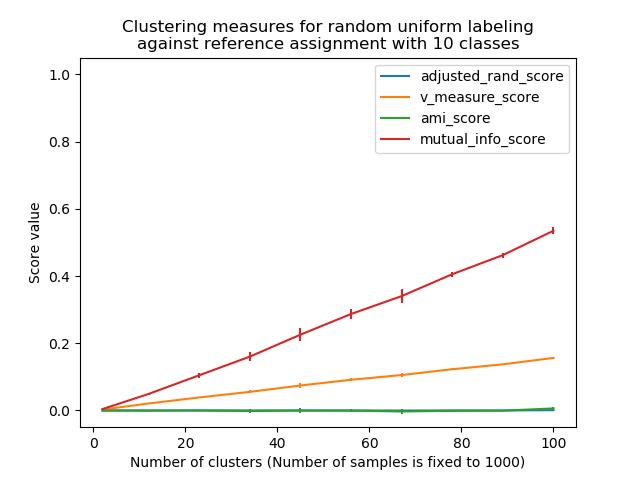
非-调整测度(如V-测度)显示了聚类数与样本数之间的依赖关系:随机标记的平均V-度量随着聚类数接近用于计算度量的样本总数而显著增加。
调整后的机会度量,如ARI,显示了一些围绕中心平均得分为0.0的随机变化,对每个类每个样本都适用。
只有经过调整的测度才能安全地作为一个一致性指标来评估给定k值的聚类算法在数据集的各个重叠子样本上的平均稳定性。

Computing adjusted_rand_score for 10 values of n_clusters and n_samples=100
done in 0.032s
Computing v_measure_score for 10 values of n_clusters and n_samples=100
done in 0.074s
Computing ami_score for 10 values of n_clusters and n_samples=100
done in 0.468s
Computing mutual_info_score for 10 values of n_clusters and n_samples=100
done in 0.042s
Computing adjusted_rand_score for 10 values of n_clusters and n_samples=1000
done in 0.072s
Computing v_measure_score for 10 values of n_clusters and n_samples=1000
done in 0.088s
Computing ami_score for 10 values of n_clusters and n_samples=1000
done in 0.290s
Computing mutual_info_score for 10 values of n_clusters and n_samples=1000
done in 0.066s
print(__doc__)

# Author: Olivier Grisel <olivier.grisel@ensta.org>
# License: BSD 3 clause

import numpy as np
import matplotlib.pyplot as plt
from time import time
from sklearn import metrics

def uniform_labelings_scores(score_func, n_samples, n_clusters_range,
                             fixed_n_classes=None, n_runs=5, seed=42):
    """Compute score for 2 random uniform cluster labelings.

    Both random labelings have the same number of clusters for each value
    possible value in ``n_clusters_range``.

    When fixed_n_classes is not None the first labeling is considered a ground
    truth class assignment with fixed number of classes.
    """
    random_labels = np.random.RandomState(seed).randint
    scores = np.zeros((len(n_clusters_range), n_runs))

    if fixed_n_classes is not None:
        labels_a = random_labels(low=0, high=fixed_n_classes, size=n_samples)

    for i, k in enumerate(n_clusters_range):
        for j in range(n_runs):
            if fixed_n_classes is None:
                labels_a = random_labels(low=0, high=k, size=n_samples)
            labels_b = random_labels(low=0, high=k, size=n_samples)
            scores[i, j] = score_func(labels_a, labels_b)
    return scores


def ami_score(U, V):
    return metrics.adjusted_mutual_info_score(U, V)

score_funcs = [
    metrics.adjusted_rand_score,
    metrics.v_measure_score,
    ami_score,
    metrics.mutual_info_score,
]

# 2 independent random clusterings with equal cluster number

n_samples = 100
n_clusters_range = np.linspace(2, n_samples, 10).astype(np.int)

plt.figure(1)

plots = []
names = []
for score_func in score_funcs:
    print("Computing %s for %d values of n_clusters and n_samples=%d"
          % (score_func.__name__, len(n_clusters_range), n_samples))

    t0 = time()
    scores = uniform_labelings_scores(score_func, n_samples, n_clusters_range)
    print("done in %0.3fs" % (time() - t0))
    plots.append(plt.errorbar(
        n_clusters_range, np.median(scores, axis=1), scores.std(axis=1))[0])
    names.append(score_func.__name__)

plt.title("Clustering measures for 2 random uniform labelings\n"
          "with equal number of clusters")
plt.xlabel('Number of clusters (Number of samples is fixed to %d)' % n_samples)
plt.ylabel('Score value')
plt.legend(plots, names)
plt.ylim(bottom=-0.05, top=1.05)


# Random labeling with varying n_clusters against ground class labels
# with fixed number of clusters

n_samples = 1000
n_clusters_range = np.linspace(2, 100, 10).astype(np.int)
n_classes = 10

plt.figure(2)

plots = []
names = []
for score_func in score_funcs:
    print("Computing %s for %d values of n_clusters and n_samples=%d"
          % (score_func.__name__, len(n_clusters_range), n_samples))

    t0 = time()
    scores = uniform_labelings_scores(score_func, n_samples, n_clusters_range,
                                      fixed_n_classes=n_classes)
    print("done in %0.3fs" % (time() - t0))
    plots.append(plt.errorbar(
        n_clusters_range, scores.mean(axis=1), scores.std(axis=1))[0])
    names.append(score_func.__name__)

plt.title("Clustering measures for random uniform labeling\n"
          "against reference assignment with %d classes" % n_classes)
plt.xlabel('Number of clusters (Number of samples is fixed to %d)' % n_samples)
plt.ylabel('Score value')
plt.ylim(bottom=-0.05, top=1.05)
plt.legend(plots, names)
plt.show()
脚本的总运行时间:(0分1.331秒)
Download Python source code:plot_adjusted_for_chance_measures.py
Download Jupyter notebook:plot_adjusted_for_chance_measures.ipynb

