

BIRCH和MiniBatchKMeans的比较
这个例子比较了Birch(有和没有全局聚类步骤)和MiniBatchKMeans在一个使用make_blobs生成的包含100000个样本和两个特征的人工数据集中的运行时间。
如果n_clusters设置为None,则将数据从100,000个样本减少到158个聚类。这可以看作是在最终(全局)聚类步骤之前的预处理步骤,该步骤将这158个聚类进一步缩减为100个聚类。
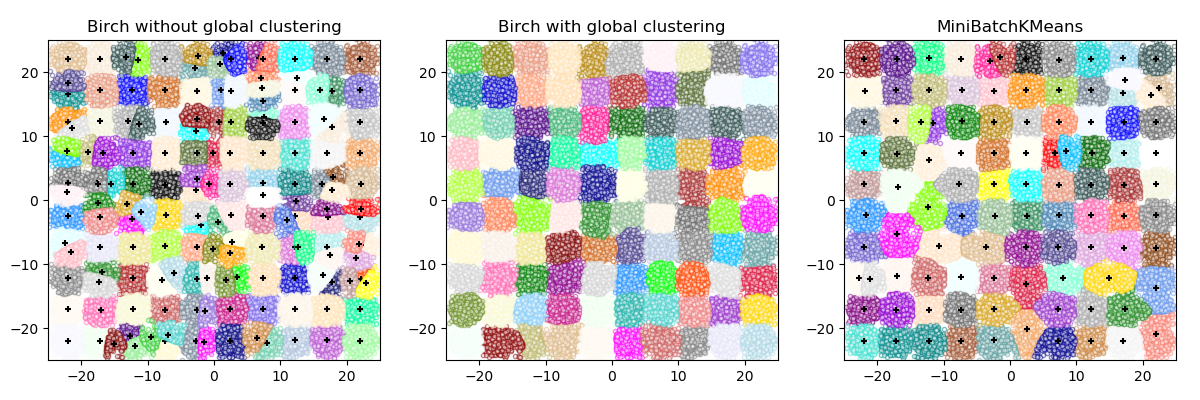
Birch without global clustering as the final step took 3.58 seconds
n_clusters : 158
Birch with global clustering as the final step took 3.51 seconds
n_clusters : 100
Time taken to run MiniBatchKMeans 3.69 seconds
# Authors: Manoj Kumar <manojkumarsivaraj334@gmail.com
#          Alexandre Gramfort <alexandre.gramfort@telecom-paristech.fr>
# License: BSD 3 clause

print(__doc__)

from itertools import cycle
from time import time
import numpy as np
import matplotlib.pyplot as plt
import matplotlib.colors as colors

from sklearn.cluster import Birch, MiniBatchKMeans
from sklearn.datasets import make_blobs


# Generate centers for the blobs so that it forms a 10 X 10 grid.
xx = np.linspace(-22, 22, 10)
yy = np.linspace(-22, 22, 10)
xx, yy = np.meshgrid(xx, yy)
n_centres = np.hstack((np.ravel(xx)[:, np.newaxis],
                       np.ravel(yy)[:, np.newaxis]))

# Generate blobs to do a comparison between MiniBatchKMeans and Birch.
X, y = make_blobs(n_samples=100000, centers=n_centres, random_state=0)

# Use all colors that matplotlib provides by default.
colors_ = cycle(colors.cnames.keys())

fig = plt.figure(figsize=(12, 4))
fig.subplots_adjust(left=0.04, right=0.98, bottom=0.1, top=0.9)

# Compute clustering with Birch with and without the final clustering step
# and plot.
birch_models = [Birch(threshold=1.7, n_clusters=None),
                Birch(threshold=1.7, n_clusters=100)]
final_step = ['without global clustering', 'with global clustering']

for ind, (birch_model, info) in enumerate(zip(birch_models, final_step)):
    t = time()
    birch_model.fit(X)
    time_ = time() - t
    print("Birch %s as the final step took %0.2f seconds" % (
          info, (time() - t)))

    # Plot result
    labels = birch_model.labels_
    centroids = birch_model.subcluster_centers_
    n_clusters = np.unique(labels).size
    print("n_clusters : %d" % n_clusters)

    ax = fig.add_subplot(1, 3, ind + 1)
    for this_centroid, k, col in zip(centroids, range(n_clusters), colors_):
        mask = labels == k
        ax.scatter(X[mask, 0], X[mask, 1],
                   c='w', edgecolor=col, marker='.', alpha=0.5)
        if birch_model.n_clusters is None:
            ax.scatter(this_centroid[0], this_centroid[1], marker='+',
                       c='k', s=25)
    ax.set_ylim([-25, 25])
    ax.set_xlim([-25, 25])
    ax.set_autoscaley_on(False)
    ax.set_title('Birch %s' % info)

# Compute clustering with MiniBatchKMeans.
mbk = MiniBatchKMeans(init='k-means++', n_clusters=100, batch_size=100,
                      n_init=10, max_no_improvement=10, verbose=0,
                      random_state=0)
t0 = time()
mbk.fit(X)
t_mini_batch = time() - t0
print("Time taken to run MiniBatchKMeans %0.2f seconds" % t_mini_batch)
mbk_means_labels_unique = np.unique(mbk.labels_)

ax = fig.add_subplot(1, 3, 3)
for this_centroid, k, col in zip(mbk.cluster_centers_,
                                 range(n_clusters), colors_):
    mask = mbk.labels_ == k
    ax.scatter(X[mask, 0], X[mask, 1], marker='.',
               c='w', edgecolor=col, alpha=0.5)
    ax.scatter(this_centroid[0], this_centroid[1], marker='+',
               c='k', s=25)
ax.set_xlim([-25, 25])
ax.set_ylim([-25, 25])
ax.set_title("MiniBatchKMeans")
ax.set_autoscaley_on(False)
plt.show()
脚本的总运行时间:(0分13.814秒)
Download Python source code:plot_birch_vs_minibatchkmeans.py
Download Jupyter notebook:plot_birch_vs_minibatchkmeans.ipynb

