

归纳聚类
聚类可能很昂贵,特别是当我们的数据集包含数百万个数据点时。许多聚类算法都不是归纳的,因此,如果不重新计算聚类,就不能直接应用于新的数据样本,这可能是棘手的。相反,我们可以使用聚类来学习带有分类器的归纳模型,这有几个好处:
它允许聚类扩展并应用于新的数据 不像对新样品重新组合,它确保标签程序随着时间的推移是一致的 它允许我们使用分类器的推理能力来描述或解释聚类
这个例子说明了一个元估计器的一般实现,它通过从聚类标签中诱导一个分类器来扩展聚类。
# Authors: Chirag Nagpal
# Christos Aridas
print(__doc__)
import numpy as np
import matplotlib.pyplot as plt
from sklearn.base import BaseEstimator, clone
from sklearn.cluster import AgglomerativeClustering
from sklearn.datasets import make_blobs
from sklearn.ensemble import RandomForestClassifier
from sklearn.utils.metaestimators import if_delegate_has_method
N_SAMPLES = 5000
RANDOM_STATE = 42
class InductiveClusterer(BaseEstimator):
def __init__(self, clusterer, classifier):
self.clusterer = clusterer
self.classifier = classifier
def fit(self, X, y=None):
self.clusterer_ = clone(self.clusterer)
self.classifier_ = clone(self.classifier)
y = self.clusterer_.fit_predict(X)
self.classifier_.fit(X, y)
return self
@if_delegate_has_method(delegate='classifier_')
def predict(self, X):
return self.classifier_.predict(X)
@if_delegate_has_method(delegate='classifier_')
def decision_function(self, X):
return self.classifier_.decision_function(X)
def plot_scatter(X, color, alpha=0.5):
return plt.scatter(X[:, 0],
X[:, 1],
c=color,
alpha=alpha,
edgecolor='k')
# Generate some training data from clustering
X, y = make_blobs(n_samples=N_SAMPLES,
cluster_std=[1.0, 1.0, 0.5],
centers=[(-5, -5), (0, 0), (5, 5)],
random_state=RANDOM_STATE)
# Train a clustering algorithm on the training data and get the cluster labels
clusterer = AgglomerativeClustering(n_clusters=3)
cluster_labels = clusterer.fit_predict(X)
plt.figure(figsize=(12, 4))
plt.subplot(131)
plot_scatter(X, cluster_labels)
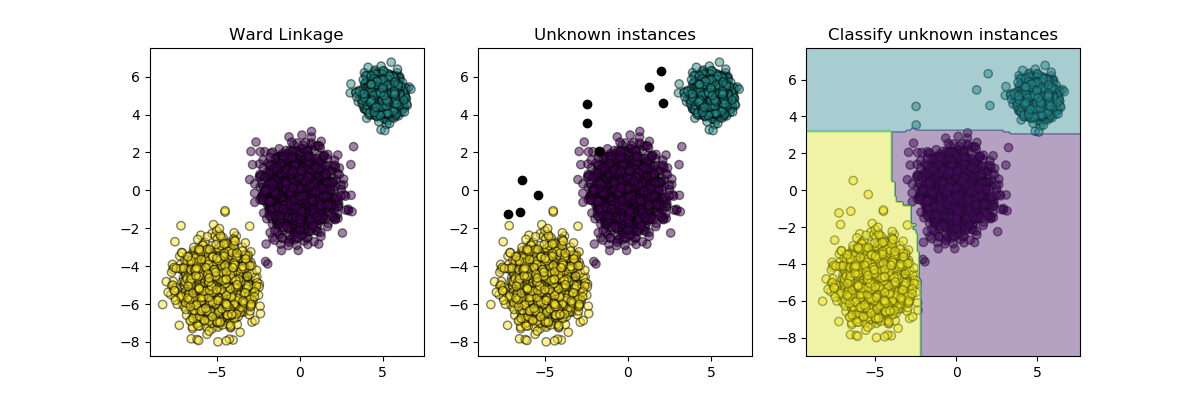
plt.title("Ward Linkage")
# Generate new samples and plot them along with the original dataset
X_new, y_new = make_blobs(n_samples=10,
centers=[(-7, -1), (-2, 4), (3, 6)],
random_state=RANDOM_STATE)
plt.subplot(132)
plot_scatter(X, cluster_labels)
plot_scatter(X_new, 'black', 1)
plt.title("Unknown instances")
# Declare the inductive learning model that it will be used to
# predict cluster membership for unknown instances
classifier = RandomForestClassifier(random_state=RANDOM_STATE)
inductive_learner = InductiveClusterer(clusterer, classifier).fit(X)
probable_clusters = inductive_learner.predict(X_new)
plt.subplot(133)
plot_scatter(X, cluster_labels)
plot_scatter(X_new, probable_clusters)
# Plotting decision regions
x_min, x_max = X[:, 0].min() - 1, X[:, 0].max() + 1
y_min, y_max = X[:, 1].min() - 1, X[:, 1].max() + 1
xx, yy = np.meshgrid(np.arange(x_min, x_max, 0.1),
np.arange(y_min, y_max, 0.1))
Z = inductive_learner.predict(np.c_[xx.ravel(), yy.ravel()])
Z = Z.reshape(xx.shape)
plt.contourf(xx, yy, Z, alpha=0.4)
plt.title("Classify unknown instances")
plt.show()
脚本的总运行时间:(0分3.167秒)

