

支持向量机:有权重的样本
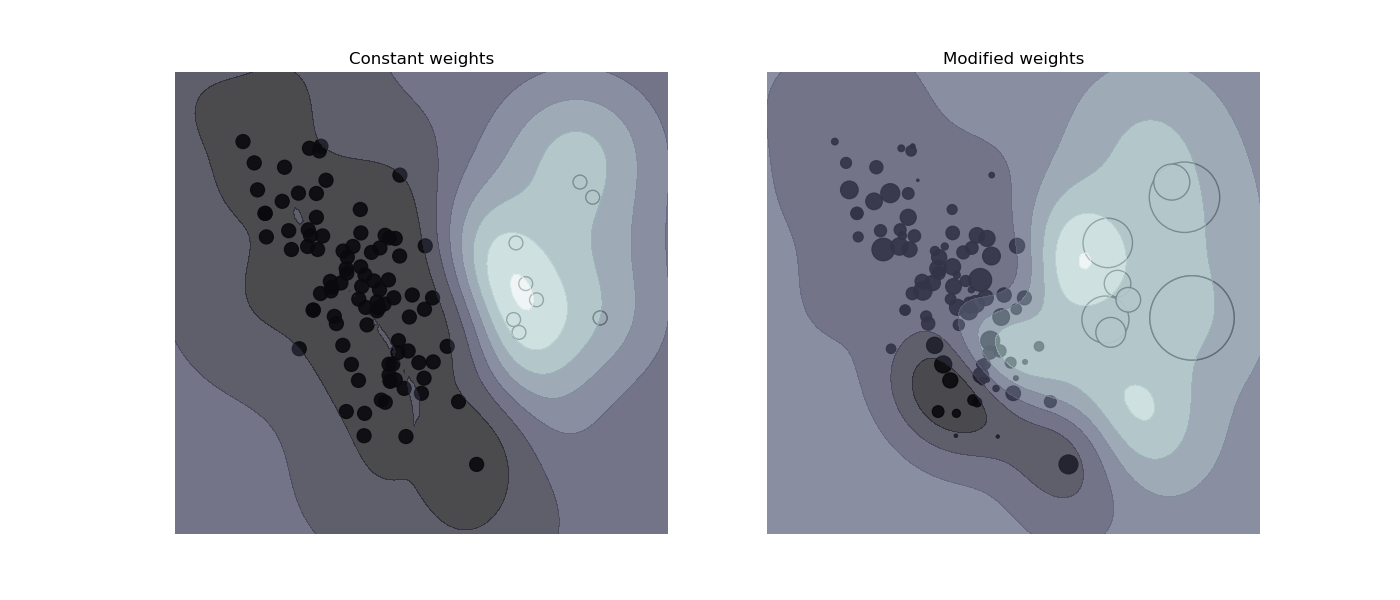
本案例绘制加权数据集的决策函数,其中点的大小与其权重成正比。
样本加权会重新缩放C参数,这意味着分类器将更多的重点放在正确设置这些点上。 效果通常可能很微妙。为了强调此处的效果,我们特别加大了离群值的权重,使决策边界的变形非常明显。
输出:
输入:
print(__doc__)

import numpy as np
import matplotlib.pyplot as plt
from sklearn import svm


def plot_decision_function(classifier, sample_weight, axis, title):
    # 绘制决策边界
    xx, yy = np.meshgrid(np.linspace(-4, 5, 500), np.linspace(-4, 5, 500))

    Z = classifier.decision_function(np.c_[xx.ravel(), yy.ravel()])
    Z = Z.reshape(xx.shape)

    # 绘制直线,点和最接近平面的向量
    axis.contourf(xx, yy, Z, alpha=0.75, cmap=plt.cm.bone)
    axis.scatter(X[:, 0], X[:, 1], c=y, s=100 * sample_weight, alpha=0.9,
                 cmap=plt.cm.bone, edgecolors='black')

    axis.axis('off')
    axis.set_title(title)

# 创建20个点
np.random.seed(0)
X = np.r_[np.random.randn(10, 2) + [1, 1], np.random.randn(10, 2)]
y = [1] * 10 + [-1] * 10
sample_weight_last_ten = abs(np.random.randn(len(X)))
sample_weight_constant = np.ones(len(X))
# 对离群值设置更大的权重
sample_weight_last_ten[15:] *= 5
sample_weight_last_ten[9] *= 15

# 供参考,首次拟合时我们不对样本设置权重

# 拟合模型
clf_weights = svm.SVC(gamma=1)
clf_weights.fit(X, y, sample_weight=sample_weight_last_ten)

clf_no_weights = svm.SVC(gamma=1)
clf_no_weights.fit(X, y)

fig, axes = plt.subplots(1, 2, figsize=(14, 6))
plot_decision_function(clf_no_weights, sample_weight_constant, axes[0],
                       "Constant weights")
plot_decision_function(clf_weights, sample_weight_last_ten, axes[1],
                       "Modified weights")

plt.show()
脚本的总运行时间:(2分钟59.930秒)

