

鲁棒线性估计拟合
这里,正弦函数与3阶多项式拟合,其数值接近于零。
在不同的情况下,稳健的拟合会被降级:
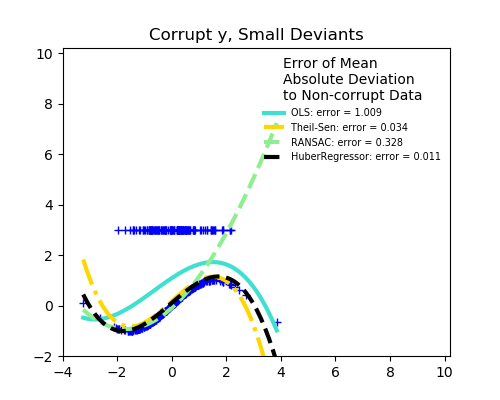
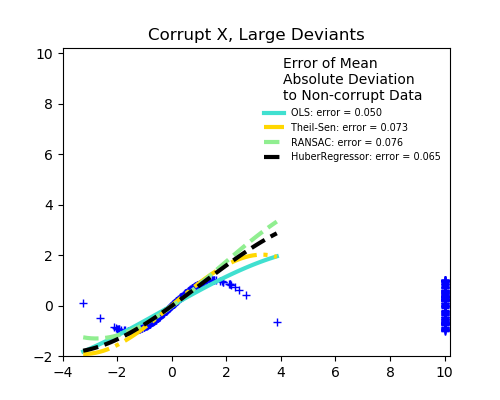
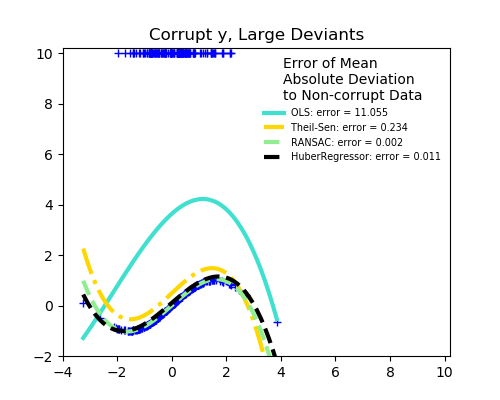
没有测量误差,只有建模误差(用多项式拟合正弦) X测量误差 y测量误差
对非损坏新数据的中位绝对偏差用来判断预测的质量。
我们能看到的是:
RANSAC对y方向的强离群值是有利的。 TheilSen对X方向和y方向的小离群值都很好,但是有一个断点,它的表现比OLS差。 HuberRegressor的分数不能直接与TheilSen和RANSAC进行比较,因为它并不试图完全过滤异常值,而是减少了它们的影响。 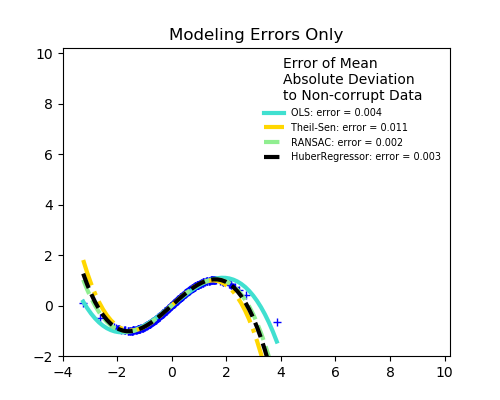

from matplotlib import pyplot as plt
import numpy as np

from sklearn.linear_model import (
    LinearRegression, TheilSenRegressor, RANSACRegressor, HuberRegressor)
from sklearn.metrics import mean_squared_error
from sklearn.preprocessing import PolynomialFeatures
from sklearn.pipeline import make_pipeline

np.random.seed(42)

X = np.random.normal(size=400)
y = np.sin(X)
# Make sure that it X is 2D
X = X[:, np.newaxis]

X_test = np.random.normal(size=200)
y_test = np.sin(X_test)
X_test = X_test[:, np.newaxis]

y_errors = y.copy()
y_errors[::3] = 3

X_errors = X.copy()
X_errors[::3] = 3

y_errors_large = y.copy()
y_errors_large[::3] = 10

X_errors_large = X.copy()
X_errors_large[::3] = 10

estimators = [('OLS', LinearRegression()),
              ('Theil-Sen', TheilSenRegressor(random_state=42)),
              ('RANSAC', RANSACRegressor(random_state=42)),
              ('HuberRegressor', HuberRegressor())]
colors = {'OLS': 'turquoise', 'Theil-Sen': 'gold', 'RANSAC': 'lightgreen', 'HuberRegressor': 'black'}
linestyle = {'OLS': '-', 'Theil-Sen': '-.', 'RANSAC': '--', 'HuberRegressor': '--'}
lw = 3

x_plot = np.linspace(X.min(), X.max())
for title, this_X, this_y in [
        ('Modeling Errors Only', X, y),
        ('Corrupt X, Small Deviants', X_errors, y),
        ('Corrupt y, Small Deviants', X, y_errors),
        ('Corrupt X, Large Deviants', X_errors_large, y),
        ('Corrupt y, Large Deviants', X, y_errors_large)]:
    plt.figure(figsize=(5, 4))
    plt.plot(this_X[:, 0], this_y, 'b+')

    for name, estimator in estimators:
        model = make_pipeline(PolynomialFeatures(3), estimator)
        model.fit(this_X, this_y)
        mse = mean_squared_error(model.predict(X_test), y_test)
        y_plot = model.predict(x_plot[:, np.newaxis])
        plt.plot(x_plot, y_plot, color=colors[name], linestyle=linestyle[name],
                 linewidth=lw, label='%s: error = %.3f' % (name, mse))

    legend_title = 'Error of Mean\nAbsolute Deviation\nto Non-corrupt Data'
    legend = plt.legend(loc='upper right', frameon=False, title=legend_title,
                        prop=dict(size='x-small'))
    plt.xlim(-4, 10.2)
    plt.ylim(-2, 10.2)
    plt.title(title)
plt.show()
脚本的总运行时间:(0分2.564秒)

