

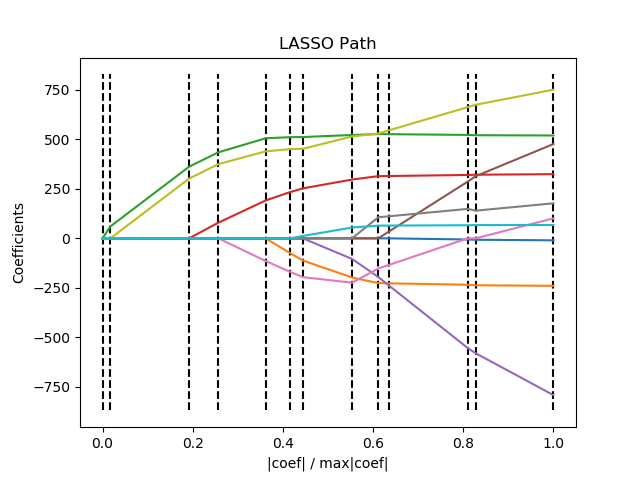
使用LARS的Lasso路径
在糖尿病数据集上使用LARS算法计算沿正则化参数的Lasso路径。每种颜色都表示系数向量的不同特征,并表示为正则化参数的函数。
Computing regularization path using the LARS ...
.
print(__doc__)

# Author: Fabian Pedregosa <fabian.pedregosa@inria.fr>
#         Alexandre Gramfort <alexandre.gramfort@inria.fr>
# License: BSD 3 clause

import numpy as np
import matplotlib.pyplot as plt

from sklearn import linear_model
from sklearn import datasets

X, y = datasets.load_diabetes(return_X_y=True)

print("Computing regularization path using the LARS ...")
_, _, coefs = linear_model.lars_path(X, y, method='lasso', verbose=True)

xx = np.sum(np.abs(coefs.T), axis=1)
xx /= xx[-1]

plt.plot(xx, coefs.T)
ymin, ymax = plt.ylim()
plt.vlines(xx, ymin, ymax, linestyle='dashed')
plt.xlabel('|coef| / max|coef|')
plt.ylabel('Coefficients')
plt.title('LASSO Path')
plt.axis('tight')
plt.show()
脚本的总运行时间:(0分0.094秒)

