

强异常数据集上的Huber回归与岭回归
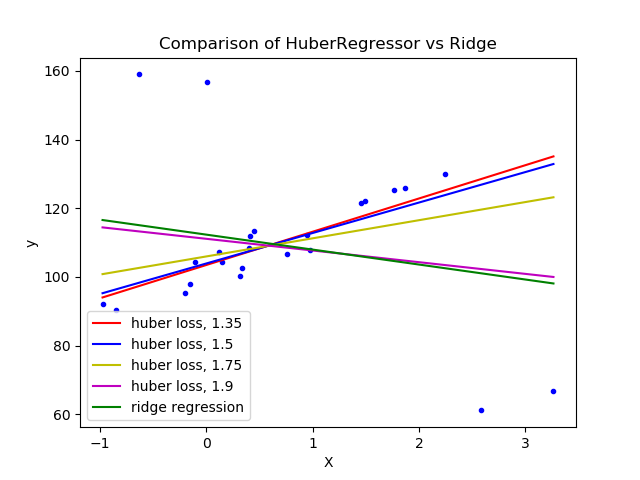
在有异常值的数据集上拟合岭回归和Huber回归。
这个例子表明, 岭回归的预测受数据集的离群值的影响很大。Huber回归受离群值的影响较小, 因为模型用的线性损失。随着Huber回归方程参数epsilon的增大,决策函数接近于岭回归。
# Authors: Manoj Kumar mks542@nyu.edu
# License: BSD 3 clause

print(__doc__)

import numpy as np
import matplotlib.pyplot as plt

from sklearn.datasets import make_regression
from sklearn.linear_model import HuberRegressor, Ridge

# Generate toy data.
rng = np.random.RandomState(0)
X, y = make_regression(n_samples=20, n_features=1, random_state=0, noise=4.0,
                       bias=100.0)

# Add four strong outliers to the dataset.
X_outliers = rng.normal(0, 0.5, size=(4, 1))
y_outliers = rng.normal(0, 2.0, size=4)
X_outliers[:2, :] += X.max() + X.mean() / 4.
X_outliers[2:, :] += X.min() - X.mean() / 4.
y_outliers[:2] += y.min() - y.mean() / 4.
y_outliers[2:] += y.max() + y.mean() / 4.
X = np.vstack((X, X_outliers))
y = np.concatenate((y, y_outliers))
plt.plot(X, y, 'b.')

# Fit the huber regressor over a series of epsilon values.
colors = ['r-', 'b-', 'y-', 'm-']

x = np.linspace(X.min(), X.max(), 7)
epsilon_values = [1.35, 1.5, 1.75, 1.9]
for k, epsilon in enumerate(epsilon_values):
    huber = HuberRegressor(alpha=0.0, epsilon=epsilon)
    huber.fit(X, y)
    coef_ = huber.coef_ * x + huber.intercept_
    plt.plot(x, coef_, colors[k], label="huber loss, %s" % epsilon)

# Fit a ridge regressor to compare it to huber regressor.
ridge = Ridge(alpha=0.0, random_state=0, normalize=True)
ridge.fit(X, y)
coef_ridge = ridge.coef_
coef_ = ridge.coef_ * x + ridge.intercept_
plt.plot(x, coef_, 'g-', label="ridge regression")

plt.title("Comparison of HuberRegressor vs Ridge")
plt.xlabel("X")
plt.ylabel("y")
plt.legend(loc=0)
plt.show()
脚本的总运行时间:(0分0.118秒)

