

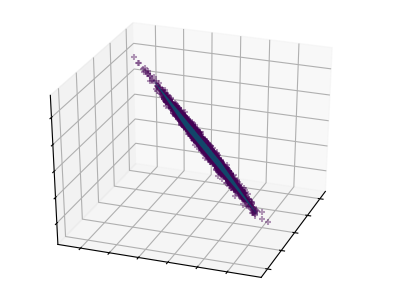
主成分分析(PCA)
这些图有助于说明点云在一个方向上是如何非常平坦的--这就是PCA选择一个不是平坦方向的地方。

print(__doc__)

# Authors: Gael Varoquaux
#          Jaques Grobler
#          Kevin Hughes
# License: BSD 3 clause

from sklearn.decomposition import PCA

from mpl_toolkits.mplot3d import Axes3D
import numpy as np
import matplotlib.pyplot as plt
from scipy import stats


# #############################################################################
# Create the data

e = np.exp(1)
np.random.seed(4)


def pdf(x):
    return 0.5 * (stats.norm(scale=0.25 / e).pdf(x)
                  + stats.norm(scale=4 / e).pdf(x))

y = np.random.normal(scale=0.5, size=(30000))
x = np.random.normal(scale=0.5, size=(30000))
z = np.random.normal(scale=0.1, size=len(x))

density = pdf(x) * pdf(y)
pdf_z = pdf(5 * z)

density *= pdf_z

a = x + y
b = 2 * y
c = a - b + z

norm = np.sqrt(a.var() + b.var())
a /= norm
b /= norm


# #############################################################################
# Plot the figures
def plot_figs(fig_num, elev, azim):
    fig = plt.figure(fig_num, figsize=(4, 3))
    plt.clf()
    ax = Axes3D(fig, rect=[0, 0, .95, 1], elev=elev, azim=azim)

    ax.scatter(a[::10], b[::10], c[::10], c=density[::10], marker='+', alpha=.4)
    Y = np.c_[a, b, c]

    # Using SciPy's SVD, this would be:
    # _, pca_score, V = scipy.linalg.svd(Y, full_matrices=False)

    pca = PCA(n_components=3)
    pca.fit(Y)
    pca_score = pca.explained_variance_ratio_
    V = pca.components_

    x_pca_axis, y_pca_axis, z_pca_axis = 3 * V.T
    x_pca_plane = np.r_[x_pca_axis[:2], - x_pca_axis[1::-1]]
    y_pca_plane = np.r_[y_pca_axis[:2], - y_pca_axis[1::-1]]
    z_pca_plane = np.r_[z_pca_axis[:2], - z_pca_axis[1::-1]]
    x_pca_plane.shape = (2, 2)
    y_pca_plane.shape = (2, 2)
    z_pca_plane.shape = (2, 2)
    ax.plot_surface(x_pca_plane, y_pca_plane, z_pca_plane)
    ax.w_xaxis.set_ticklabels([])
    ax.w_yaxis.set_ticklabels([])
    ax.w_zaxis.set_ticklabels([])


elev = -40
azim = -80
plot_figs(1, elev, azim)

elev = 30
azim = 20
plot_figs(2, elev, azim)

plt.show()
脚本的总运行时间:(0分0.198秒)

