Lasso和弹性网
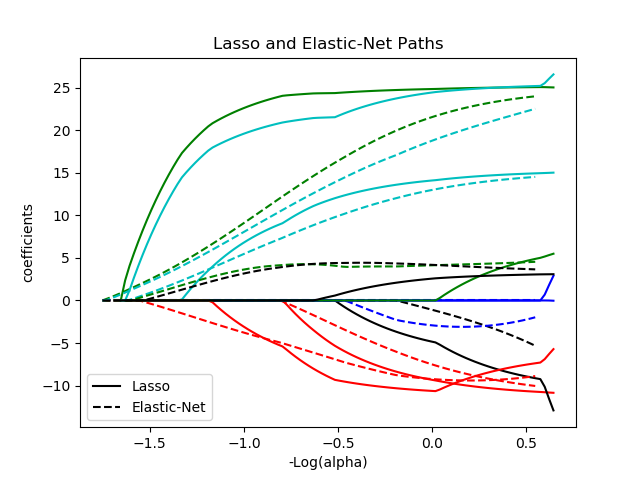
LASSO和弹性网(L1和L2惩罚)使用坐标下降来实现。
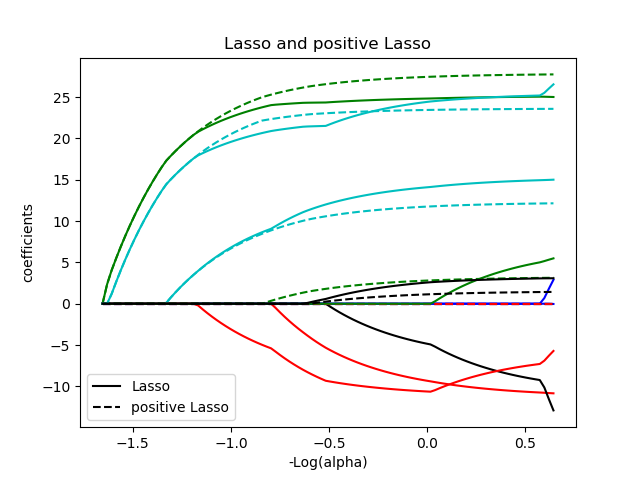
可以强迫系数为正。


Computing regularization path using the lasso...
Computing regularization path using the positive lasso...
Computing regularization path using the elastic net...
Computing regularization path using the positive elastic net...
print(__doc__)

# Author: Alexandre Gramfort <alexandre.gramfort@inria.fr>
# License: BSD 3 clause

from itertools import cycle
import numpy as np
import matplotlib.pyplot as plt

from sklearn.linear_model import lasso_path, enet_path
from sklearn import datasets


X, y = datasets.load_diabetes(return_X_y=True)


X /= X.std(axis=0)  # Standardize data (easier to set the l1_ratio parameter)

# Compute paths

eps = 5e-3  # the smaller it is the longer is the path

print("Computing regularization path using the lasso...")
alphas_lasso, coefs_lasso, _ = lasso_path(X, y, eps=eps, fit_intercept=False)

print("Computing regularization path using the positive lasso...")
alphas_positive_lasso, coefs_positive_lasso, _ = lasso_path(
    X, y, eps=eps, positive=True, fit_intercept=False)
print("Computing regularization path using the elastic net...")
alphas_enet, coefs_enet, _ = enet_path(
    X, y, eps=eps, l1_ratio=0.8, fit_intercept=False)

print("Computing regularization path using the positive elastic net...")
alphas_positive_enet, coefs_positive_enet, _ = enet_path(
    X, y, eps=eps, l1_ratio=0.8, positive=True, fit_intercept=False)

# Display results

plt.figure(1)
colors = cycle(['b', 'r', 'g', 'c', 'k'])
neg_log_alphas_lasso = -np.log10(alphas_lasso)
neg_log_alphas_enet = -np.log10(alphas_enet)
for coef_l, coef_e, c in zip(coefs_lasso, coefs_enet, colors):
    l1 = plt.plot(neg_log_alphas_lasso, coef_l, c=c)
    l2 = plt.plot(neg_log_alphas_enet, coef_e, linestyle='--', c=c)

plt.xlabel('-Log(alpha)')
plt.ylabel('coefficients')
plt.title('Lasso and Elastic-Net Paths')
plt.legend((l1[-1], l2[-1]), ('Lasso', 'Elastic-Net'), loc='lower left')
plt.axis('tight')


plt.figure(2)
neg_log_alphas_positive_lasso = -np.log10(alphas_positive_lasso)
for coef_l, coef_pl, c in zip(coefs_lasso, coefs_positive_lasso, colors):
    l1 = plt.plot(neg_log_alphas_lasso, coef_l, c=c)
    l2 = plt.plot(neg_log_alphas_positive_lasso, coef_pl, linestyle='--', c=c)

plt.xlabel('-Log(alpha)')
plt.ylabel('coefficients')
plt.title('Lasso and positive Lasso')
plt.legend((l1[-1], l2[-1]), ('Lasso', 'positive Lasso'), loc='lower left')
plt.axis('tight')


plt.figure(3)
neg_log_alphas_positive_enet = -np.log10(alphas_positive_enet)
for (coef_e, coef_pe, c) in zip(coefs_enet, coefs_positive_enet, colors):
    l1 = plt.plot(neg_log_alphas_enet, coef_e, c=c)
    l2 = plt.plot(neg_log_alphas_positive_enet, coef_pe, linestyle='--', c=c)

plt.xlabel('-Log(alpha)')
plt.ylabel('coefficients')
plt.title('Elastic-Net and positive Elastic-Net')
plt.legend((l1[-1], l2[-1]), ('Elastic-Net', 'positive Elastic-Net'),
           loc='lower left')
plt.axis('tight')
plt.show()
脚本的总运行时间:(0分0.399秒)
Download Python source code:plot_lasso_coordinate_descent_path.py
Download Jupyter notebook:plot_lasso_coordinate_descent_path.ipynb


