

基于K均值的颜色量化
对颐和园(中国)的图像执行像素级矢量量化(VQ),将显示该图像所需的颜色数量从96,615种独特颜色减少到64种,同时保持整体外观质量。
在本例中,像素在3D空间中表示,K-均值用于查找64种颜色簇。在图像处理文献中,从K均值(聚类中心)获得的码本称为调色板。使用单个字节,最多可以寻址256种颜色,而RGB编码则需要每个像素3个字节。例如,GIF文件格式使用这样的调色板。
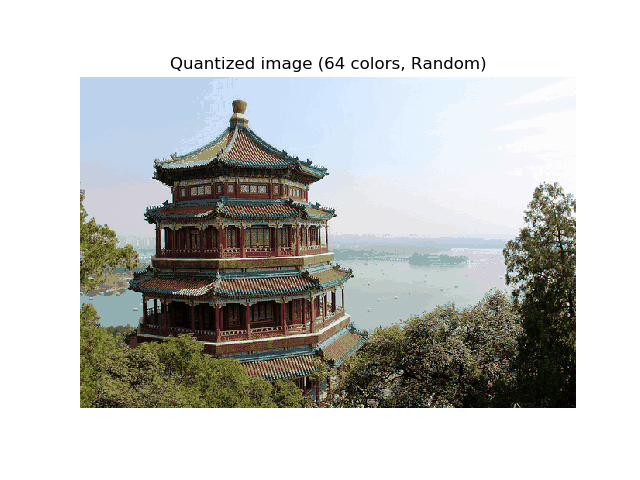
作为比较,还显示了使用随机码本(随机拾取颜色)的量化图像。


Fitting model on a small sub-sample of the data
done in 0.378s.
Predicting color indices on the full image (k-means)
done in 0.046s.
Predicting color indices on the full image (random)
done in 0.174s.
# Authors: Robert Layton <robertlayton@gmail.com>
#          Olivier Grisel <olivier.grisel@ensta.org>
#          Mathieu Blondel <mathieu@mblondel.org>
#
# License: BSD 3 clause

print(__doc__)
import numpy as np
import matplotlib.pyplot as plt
from sklearn.cluster import KMeans
from sklearn.metrics import pairwise_distances_argmin
from sklearn.datasets import load_sample_image
from sklearn.utils import shuffle
from time import time

n_colors = 64

# Load the Summer Palace photo
china = load_sample_image("china.jpg")

# Convert to floats instead of the default 8 bits integer coding. Dividing by
# 255 is important so that plt.imshow behaves works well on float data (need to
# be in the range [0-1])
china = np.array(china, dtype=np.float64) / 255

# Load Image and transform to a 2D numpy array.
w, h, d = original_shape = tuple(china.shape)
assert d == 3
image_array = np.reshape(china, (w * h, d))

print("Fitting model on a small sub-sample of the data")
t0 = time()
image_array_sample = shuffle(image_array, random_state=0)[:1000]
kmeans = KMeans(n_clusters=n_colors, random_state=0).fit(image_array_sample)
print("done in %0.3fs." % (time() - t0))

# Get labels for all points
print("Predicting color indices on the full image (k-means)")
t0 = time()
labels = kmeans.predict(image_array)
print("done in %0.3fs." % (time() - t0))


codebook_random = shuffle(image_array, random_state=0)[:n_colors]
print("Predicting color indices on the full image (random)")
t0 = time()
labels_random = pairwise_distances_argmin(codebook_random,
                                          image_array,
                                          axis=0)
print("done in %0.3fs." % (time() - t0))


def recreate_image(codebook, labels, w, h):
    """Recreate the (compressed) image from the code book & labels"""
    d = codebook.shape[1]
    image = np.zeros((w, h, d))
    label_idx = 0
    for i in range(w):
        for j in range(h):
            image[i][j] = codebook[labels[label_idx]]
            label_idx += 1
    return image

# Display all results, alongside original image
plt.figure(1)
plt.clf()
plt.axis('off')
plt.title('Original image (96,615 colors)')
plt.imshow(china)

plt.figure(2)
plt.clf()
plt.axis('off')
plt.title('Quantized image (64 colors, K-Means)')
plt.imshow(recreate_image(kmeans.cluster_centers_, labels, w, h))

plt.figure(3)
plt.clf()
plt.axis('off')
plt.title('Quantized image (64 colors, Random)')
plt.imshow(recreate_image(codebook_random, labels_random, w, h))
plt.show()
脚本的总运行时间:(0分1.615秒)

