

K-means聚类
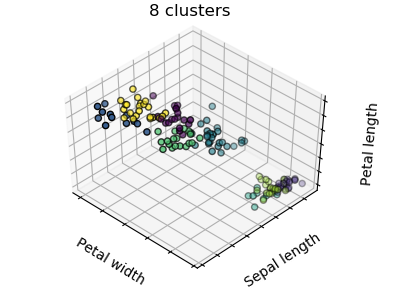
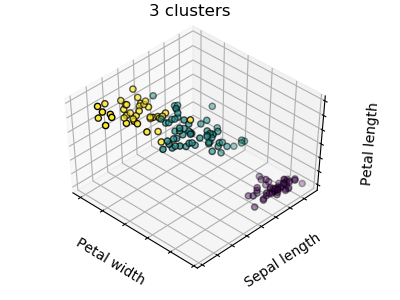
图中首先显示了使用一个K-means算法产生三个聚类会是什么样的结果。然后显示错误初始化对分类过程的影响。通过将n_init设置为1(默认值为10),可以减少算法使用不同的质心种子运行的次数。下一幅图显示了使用八个聚类所能提供的信息,并最终得出了基本事实。


print(__doc__)


# Code source: Gaël Varoquaux
# Modified for documentation by Jaques Grobler
# License: BSD 3 clause

import numpy as np
import matplotlib.pyplot as plt
# Though the following import is not directly being used, it is required
# for 3D projection to work
from mpl_toolkits.mplot3d import Axes3D

from sklearn.cluster import KMeans
from sklearn import datasets

np.random.seed(5)

iris = datasets.load_iris()
X = iris.data
y = iris.target

estimators = [('k_means_iris_8', KMeans(n_clusters=8)),
              ('k_means_iris_3', KMeans(n_clusters=3)),
              ('k_means_iris_bad_init', KMeans(n_clusters=3, n_init=1,
                                               init='random'))]

fignum = 1
titles = ['8 clusters', '3 clusters', '3 clusters, bad initialization']
for name, est in estimators:
    fig = plt.figure(fignum, figsize=(4, 3))
    ax = Axes3D(fig, rect=[0, 0, .95, 1], elev=48, azim=134)
    est.fit(X)
    labels = est.labels_

    ax.scatter(X[:, 3], X[:, 0], X[:, 2],
               c=labels.astype(np.float), edgecolor='k')

    ax.w_xaxis.set_ticklabels([])
    ax.w_yaxis.set_ticklabels([])
    ax.w_zaxis.set_ticklabels([])
    ax.set_xlabel('Petal width')
    ax.set_ylabel('Sepal length')
    ax.set_zlabel('Petal length')
    ax.set_title(titles[fignum - 1])
    ax.dist = 12
    fignum = fignum + 1

# Plot the ground truth
fig = plt.figure(fignum, figsize=(4, 3))
ax = Axes3D(fig, rect=[0, 0, .95, 1], elev=48, azim=134)

for name, label in [('Setosa', 0),
                    ('Versicolour', 1),
                    ('Virginica', 2)]:
    ax.text3D(X[y == label, 3].mean(),
              X[y == label, 0].mean(),
              X[y == label, 2].mean() + 2, name,
              horizontalalignment='center',
              bbox=dict(alpha=.2, edgecolor='w', facecolor='w'))
# Reorder the labels to have colors matching the cluster results
y = np.choose(y, [1, 2, 0]).astype(np.float)
ax.scatter(X[:, 3], X[:, 0], X[:, 2], c=y, edgecolor='k')

ax.w_xaxis.set_ticklabels([])
ax.w_yaxis.set_ticklabels([])
ax.w_zaxis.set_ticklabels([])
ax.set_xlabel('Petal width')
ax.set_ylabel('Sepal length')
ax.set_zlabel('Petal length')
ax.set_title('Ground Truth')
ax.dist = 12

fig.show()
脚本的总运行时间:(0分0.454秒)

