

局部依赖的高级绘图
plot_partial_dependence函数返回一个PartialDependenceDisplay对象,该对象可用于绘图而无需重新计算部分依赖关系(partial dependency)。 在此示例中,我们显示了如何绘制部分依赖图以及如何使用可视化API快速自定义图。
注意:另请参见带有可视化API的ROC曲线
print(__doc__)

import pandas as pd
import matplotlib.pyplot as plt
from sklearn.datasets import load_diabetes
from sklearn.neural_network import MLPRegressor
from sklearn.preprocessing import StandardScaler
from sklearn.pipeline import make_pipeline
from sklearn.tree import DecisionTreeRegressor
from sklearn.inspection import plot_partial_dependence
在糖尿病数据集上训练数据
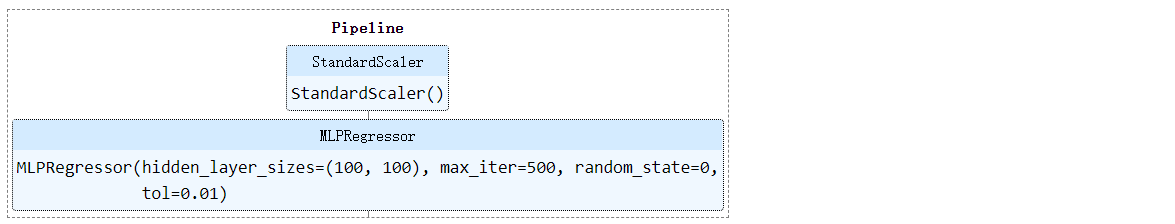
首先,我们在糖尿病数据集上训练决策树和多层感知机。
diabetes = load_diabetes()
X = pd.DataFrame(diabetes.data, columns=diabetes.feature_names)
y = diabetes.target

tree = DecisionTreeRegressor()
mlp = make_pipeline(StandardScaler(),
                    MLPRegressor(hidden_layer_sizes=(100, 100),
                                 tol=1e-2, max_iter=500, random_state=0))
tree.fit(X, y)
mlp.fit(X, y)
输出:
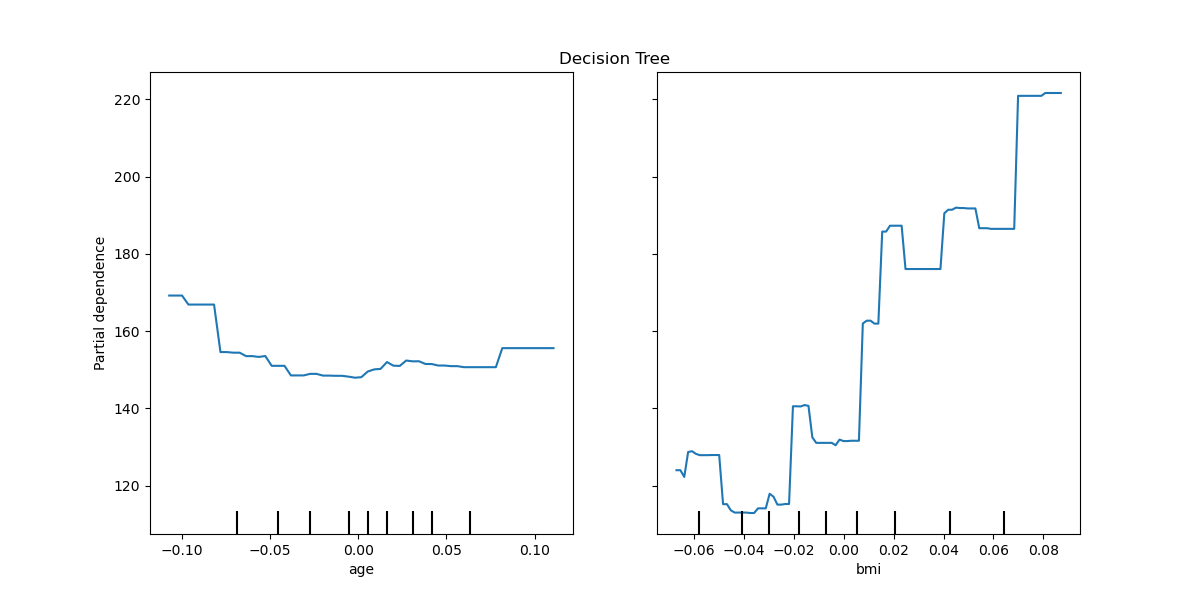
绘制两个特征的部分相关性
我们为决策树的“年龄”和“ bmi”(体重指数)特征绘制了部分依赖曲线。 具有两个功能,plot_partial_dependence期望绘制两条曲线。 这里的plot函数使用ax定义的空间放置两个图的网格。
fig, ax = plt.subplots(figsize=(12, 6))
ax.set_title("Decision Tree")
tree_disp = plot_partial_dependence(tree, X, ["age", "bmi"], ax=ax)
输出:
/home/circleci/project/sklearn/tree/_classes.py:1254: FutureWarning: the classes_ attribute is to be deprecated from version 0.22 and will be removed in 0.24.
  warnings.warn(msg, FutureWarning)
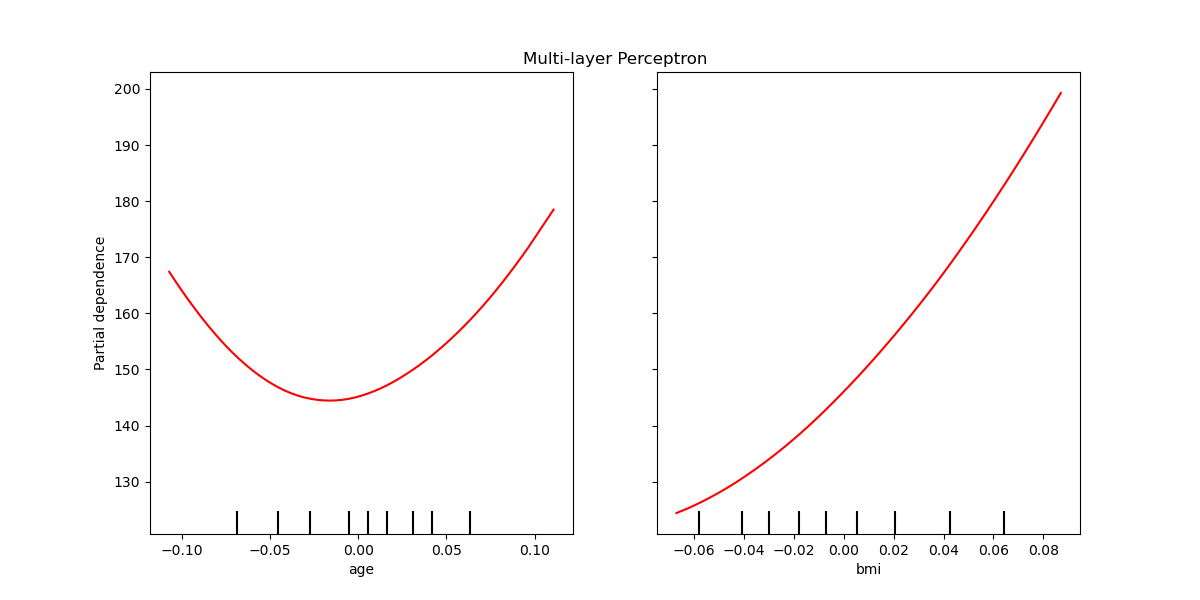
可以为多层感知机绘制部分依赖曲线。 在这种情况下,将line_kw传递给plot_partial_dependence以更改曲线的颜色。
fig, ax = plt.subplots(figsize=(12, 6))
ax.set_title("Multi-layer Perceptron")
mlp_disp = plot_partial_dependence(mlp, X, ["age", "bmi"], ax=ax,
                                   line_kw={"c": "red"})
一起绘制两个模型的部分依赖性
tree_disp和mlp_disp PartialDependenceDisplay对象包含重新创建部分依赖曲线所需的所有计算信息。 这意味着我们可以轻松创建其他图,而无需重新计算曲线。
绘制曲线的一种方法是将它们放置在同一图形中,每个模型的曲线在每一行上。 首先,我们创建一个在两行一列中具有两个轴的图形。 这两个轴传递给tree_disp和mlp_disp的绘图函数。 绘图功能将使用给定的轴来绘制部分相关性。 结果图将决策树部分相关曲线放置在第二行的多层感知器的第一行中。
fig, (ax1, ax2) = plt.subplots(2, 1, figsize=(10, 10))
tree_disp.plot(ax=ax1)
ax1.set_title("Decision Tree")
mlp_disp.plot(ax=ax2, line_kw={"c": "red"})
ax2.set_title("Multi-layer Perceptron")
输出:

Text(0.5, 1.0, 'Multi-layer Perceptron')
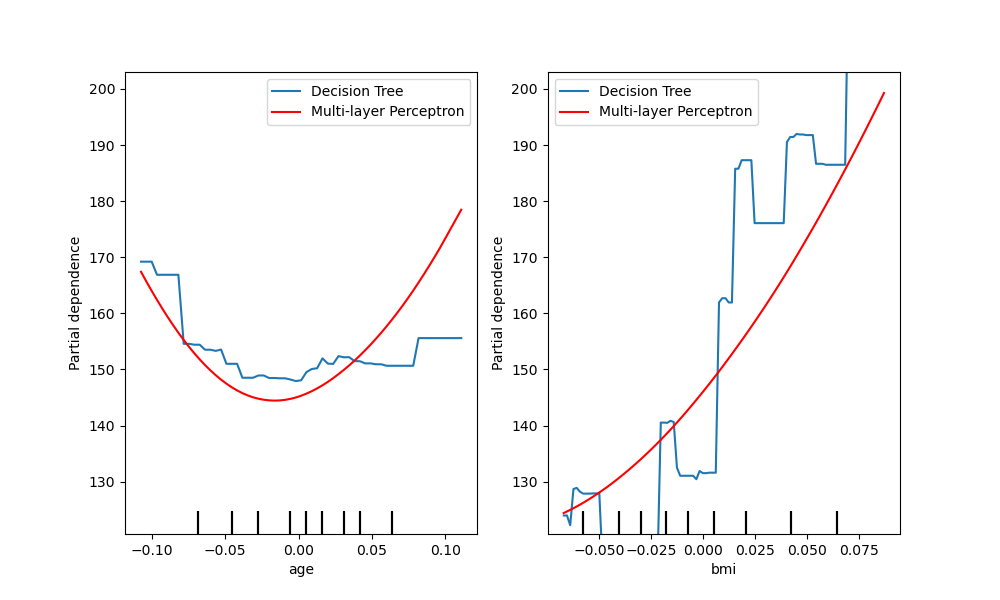
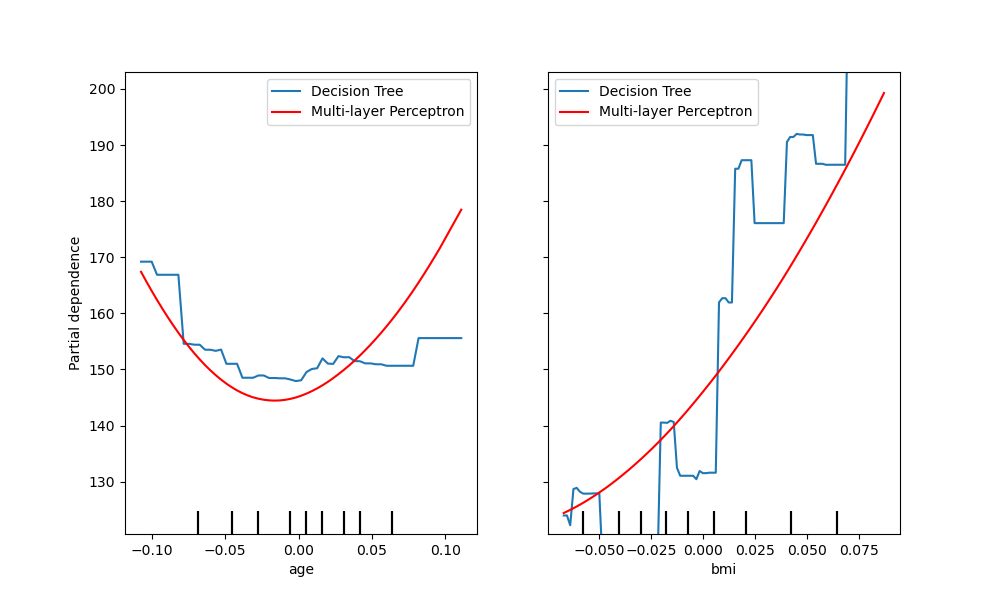
比较曲线的另一种方法是将它们绘制在彼此的顶部。 在这里,我们创建一个具有一行和两列的图形。 轴作为列表传递到绘图函数中,该列表将在同一轴上绘制每个模型的部分依赖性曲线。 轴列表的长度必须等于绘制的图数。
fig, (ax1, ax2) = plt.subplots(1, 2, figsize=(10, 6))
tree_disp.plot(ax=[ax1, ax2], line_kw={"label": "Decision Tree"})
mlp_disp.plot(ax=[ax1, ax2], line_kw={"label": "Multi-layer Perceptron",
                                      "c": "red"})
ax1.legend()
ax2.legend()
输出:
<matplotlib.legend.Legend object at 0x7f9606d26d00>
tree_disp.axes_是一个numpy数组容器,其轴用于绘制部分依赖图,可以将其传递给mlp_disp以产生将图相互叠加绘制的相同效果。 此外,mlp_disp.figure_存储图形,这允许在调用图后调整图形的大小。 在这种情况下tree_disp.axes_具有两个维度,因此图将仅在最左侧的图上显示y标签和y刻度。
tree_disp.plot(line_kw={"label": "Decision Tree"})
mlp_disp.plot(line_kw={"label": "Multi-layer Perceptron", "c": "red"},
              ax=tree_disp.axes_)
tree_disp.figure_.set_size_inches(10, 6)
tree_disp.axes_[0, 0].legend()
tree_disp.axes_[0, 1].legend()
plt.show()
输出:
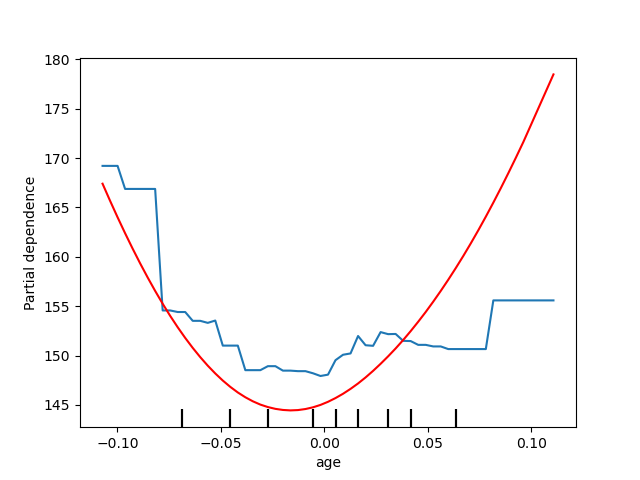
绘制一个特征的部分依赖关系
在这里,我们在同一根轴上绘制单个特征“年龄”的部分依赖曲线。 在这种情况下,tree_disp.axes_被传递到第二个绘图函数中。
tree_disp = plot_partial_dependence(tree, X, ["age"])
mlp_disp = plot_partial_dependence(mlp, X, ["age"],
                                   ax=tree_disp.axes_, line_kw={"c": "red"})
/home/circleci/project/sklearn/tree/_classes.py:1254: FutureWarning: the classes_ attribute is to be deprecated from version 0.22 and will be removed in 0.24.
  warnings.warn(msg, FutureWarning)
脚本的总运行时间:(0分钟5.157秒)

