

手写数据集上的标签传播:性能展示
本示例通过训练标签扩展模型来用很少的标签集对手写数字进行分类,展示了半监督学习的能力。
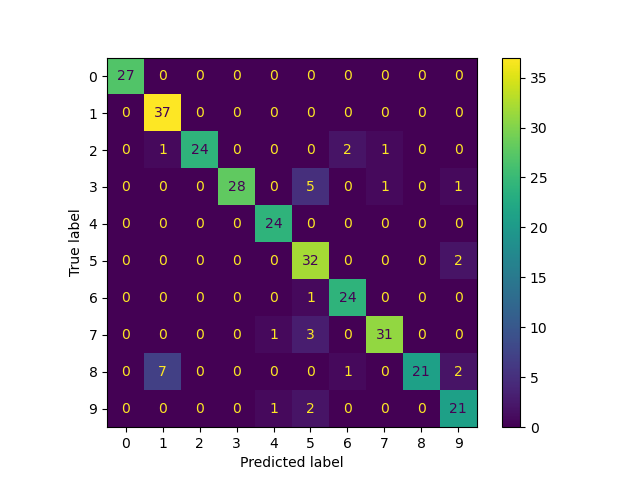
手写数字数据集共有1797个点。 该模型将使用所有点进行训练,但仅会标记30个点。 以混淆矩阵和一系列关于每个类的度量的形式的结果将是非常好的。
最后,将显示前10个最不确定的预测。
print(__doc__)

# 作者: Clay Woolam <clay@woolam.org>
# 执照: BSD

import numpy as np
import matplotlib.pyplot as plt

from scipy import stats

from sklearn import datasets
from sklearn.semi_supervised import LabelSpreading

from sklearn.metrics import confusion_matrix, classification_report

digits = datasets.load_digits()
rng = np.random.RandomState(2)
indices = np.arange(len(digits.data))
rng.shuffle(indices)

X = digits.data[indices[:340]]
y = digits.target[indices[:340]]
images = digits.images[indices[:340]]

n_total_samples = len(y)
n_labeled_points = 40

indices = np.arange(n_total_samples)

unlabeled_set = indices[n_labeled_points:]

# #############################################################################
# 每一轮都打乱顺序
y_train = np.copy(y)
y_train[unlabeled_set] = -1

# #############################################################################
# 通过LabelSpreading进行学习
lp_model = LabelSpreading(gamma=.25, max_iter=20)
lp_model.fit(X, y_train)
predicted_labels = lp_model.transduction_[unlabeled_set]
true_labels = y[unlabeled_set]

cm = confusion_matrix(true_labels, predicted_labels, labels=lp_model.classes_)

print("Label Spreading model: %d labeled & %d unlabeled points (%d total)" %
      (n_labeled_points, n_total_samples - n_labeled_points, n_total_samples))

print(classification_report(true_labels, predicted_labels))

print("Confusion matrix")
print(cm)

# #############################################################################
# 计算每个转换分布的不确定性值
pred_entropies = stats.distributions.entropy(lp_model.label_distributions_.T)

# #############################################################################
# 选择十大最不确定的标签
uncertainty_index = np.argsort(pred_entropies)[-10:]

# #############################################################################
# 绘图
f = plt.figure(figsize=(7, 5))
for index, image_index in enumerate(uncertainty_index):
    image = images[image_index]

    sub = f.add_subplot(2, 5, index + 1)
    sub.imshow(image, cmap=plt.cm.gray_r)
    plt.xticks([])
    plt.yticks([])
    sub.set_title('predict: %i\ntrue: %i' % (
        lp_model.transduction_[image_index], y[image_index]))

f.suptitle('Learning with small amount of labeled data')
输出:
Label Spreading model: 40 labeled & 300 unlabeled points (340 total)
              precision    recall  f1-score   support

           0       1.00      1.00      1.00        27
           1       0.82      1.00      0.90        37
           2       1.00      0.86      0.92        28
           3       1.00      0.80      0.89        35
           4       0.92      1.00      0.96        24
           5       0.74      0.94      0.83        34
           6       0.89      0.96      0.92        25
           7       0.94      0.89      0.91        35
           8       1.00      0.68      0.81        31
           9       0.81      0.88      0.84        24

    accuracy                           0.90       300
   macro avg       0.91      0.90      0.90       300
weighted avg       0.91      0.90      0.90       300

Confusion matrix
[[27  0  0  0  0  0  0  0  0  0]
 [ 0 37  0  0  0  0  0  0  0  0]
 [ 0  1 24  0  0  0  2  1  0  0]
 [ 0  0  0 28  0  5  0  1  0  1]
 [ 0  0  0  0 24  0  0  0  0  0]
 [ 0  0  0  0  0 32  0  0  0  2]
 [ 0  0  0  0  0  1 24  0  0  0]
 [ 0  0  0  0  1  3  0 31  0  0]
 [ 0  7  0  0  0  0  1  0 21  2]
 [ 0  0  0  0  1  2  0  0  0 21]]
脚本的总运行时间:0分钟0.318秒

