将不同缩放器对数据的影响与离群值进行比较
加利福尼亚住房数据集的特征0(中位数收入)和特征5(家庭数)具有不同的尺度,并包含一些非常大的离群值。这两个特征导致难以可视化数据,更重要的是,它们会降低许多机器学习算法的预测性能。未缩放的数据也会减慢甚至阻止许多基于梯度的估计器的收敛。
确实,许多估计器的设计假设是每个要素的取值接近零,或更重要的是,所有要素均在可比较的范围内变化。特别是,基于度量和基于梯度的估算器通常会采用近似标准化的数据(具有单位方差的中心特征)。一个明显的例外是基于决策树的估计器,它对数据的任意缩放具有鲁棒性。
本示例使用不同的缩放器,转换器和归一化器将数据带入预定义的范围内。
缩放器是线性(或更精确地说是仿射)变压器,并且在估计用于移位和缩放每个特征的参数的方式上彼此不同。
QuantileTransformer提供非线性转换,其中边缘离群值和离群值之间的距离缩小。 PowerTransformer提供了非线性转换,其中数据被映射到正态分布,以稳定方差并最小化偏斜度。
与以前的变换不同,归一化是指每个样本变换而不是每个特征变换。
以下代码有点冗长,可以直接跳转到结果分析。
# 作者:  Raghav RV <rvraghav93@gmail.com>
#       Guillaume Lemaitre <g.lemaitre58@gmail.com>
#       Thomas Unterthiner
# 执照:BSD 3 clause

import numpy as np

import matplotlib as mpl
from matplotlib import pyplot as plt
from matplotlib import cm

from sklearn.preprocessing import MinMaxScaler
from sklearn.preprocessing import minmax_scale
from sklearn.preprocessing import MaxAbsScaler
from sklearn.preprocessing import StandardScaler
from sklearn.preprocessing import RobustScaler
from sklearn.preprocessing import Normalizer
from sklearn.preprocessing import QuantileTransformer
from sklearn.preprocessing import PowerTransformer

from sklearn.datasets import fetch_california_housing

print(__doc__)

dataset = fetch_california_housing()
X_full, y_full = dataset.data, dataset.target

# 仅采用2个特征即可简化可视化
# 0特征具有长尾分布。
# 特征5有一些但很大的离群值。

X = X_full[:, [0, 5]]

distributions = [
    ('Unscaled data', X),
    ('Data after standard scaling',
        StandardScaler().fit_transform(X)),
    ('Data after min-max scaling',
        MinMaxScaler().fit_transform(X)),
    ('Data after max-abs scaling',
        MaxAbsScaler().fit_transform(X)),
    ('Data after robust scaling',
        RobustScaler(quantile_range=(25, 75)).fit_transform(X)),
    ('Data after power transformation (Yeo-Johnson)',
     PowerTransformer(method='yeo-johnson').fit_transform(X)),
    ('Data after power transformation (Box-Cox)',
     PowerTransformer(method='box-cox').fit_transform(X)),
    ('Data after quantile transformation (gaussian pdf)',
        QuantileTransformer(output_distribution='normal')
        .fit_transform(X)),
    ('Data after quantile transformation (uniform pdf)',
        QuantileTransformer(output_distribution='uniform')
        .fit_transform(X)),
    ('Data after sample-wise L2 normalizing',
        Normalizer().fit_transform(X)),
]

# 将输出范围缩放到0到1之间
y = minmax_scale(y_full)

# matplotlib <1.5中不存在plasma列(直译:血浆那一列)
cmap = getattr(cm, 'plasma_r', cm.hot_r)

def create_axes(title, figsize=(16, 6)):
    fig = plt.figure(figsize=figsize)
    fig.suptitle(title)

    # 定义第一个绘图的轴
    left, width = 0.1, 0.22
    bottom, height = 0.1, 0.7
    bottom_h = height + 0.15
    left_h = left + width + 0.02

    rect_scatter = [left, bottom, width, height]
    rect_histx = [left, bottom_h, width, 0.1]
    rect_histy = [left_h, bottom, 0.05, height]

    ax_scatter = plt.axes(rect_scatter)
    ax_histx = plt.axes(rect_histx)
    ax_histy = plt.axes(rect_histy)

    # 定义放大图的轴
    left = width + left + 0.2
    left_h = left + width + 0.02

    rect_scatter = [left, bottom, width, height]
    rect_histx = [left, bottom_h, width, 0.1]
    rect_histy = [left_h, bottom, 0.05, height]

    ax_scatter_zoom = plt.axes(rect_scatter)
    ax_histx_zoom = plt.axes(rect_histx)
    ax_histy_zoom = plt.axes(rect_histy)

    # 定义颜色条的轴
    left, width = width + left + 0.13, 0.01

    rect_colorbar = [left, bottom, width, height]
    ax_colorbar = plt.axes(rect_colorbar)

    return ((ax_scatter, ax_histy, ax_histx),
            (ax_scatter_zoom, ax_histy_zoom, ax_histx_zoom),
            ax_colorbar)


def plot_distribution(axes, X, y, hist_nbins=50, title="",
                      x0_label="", x1_label=""):
    ax, hist_X1, hist_X0 = axes

    ax.set_title(title)
    ax.set_xlabel(x0_label)
    ax.set_ylabel(x1_label)

    # 点状图
    colors = cmap(y)
    ax.scatter(X[:, 0], X[:, 1], alpha=0.5, marker='o', s=5, lw=0, c=colors)

 # 移除顶部和右侧脊柱以达到美观
    # 制作漂亮的轴布局
    ax.spines['top'].set_visible(False)
    ax.spines['right'].set_visible(False)
    ax.get_xaxis().tick_bottom()
    ax.get_yaxis().tick_left()
    ax.spines['left'].set_position(('outward', 10))
    ax.spines['bottom'].set_position(('outward', 10))

    # 轴X1的直方图(功能5)
    hist_X1.set_ylim(ax.get_ylim())
    hist_X1.hist(X[:, 1], bins=hist_nbins, orientation='horizontal',
                 color='grey', ec='grey')
    hist_X1.axis('off')

    # 轴X0的直方图(功能0)
    hist_X0.set_xlim(ax.get_xlim())
    hist_X0.hist(X[:, 0], bins=hist_nbins, orientation='vertical',
                 color='grey', ec='grey')
    hist_X0.axis('off')
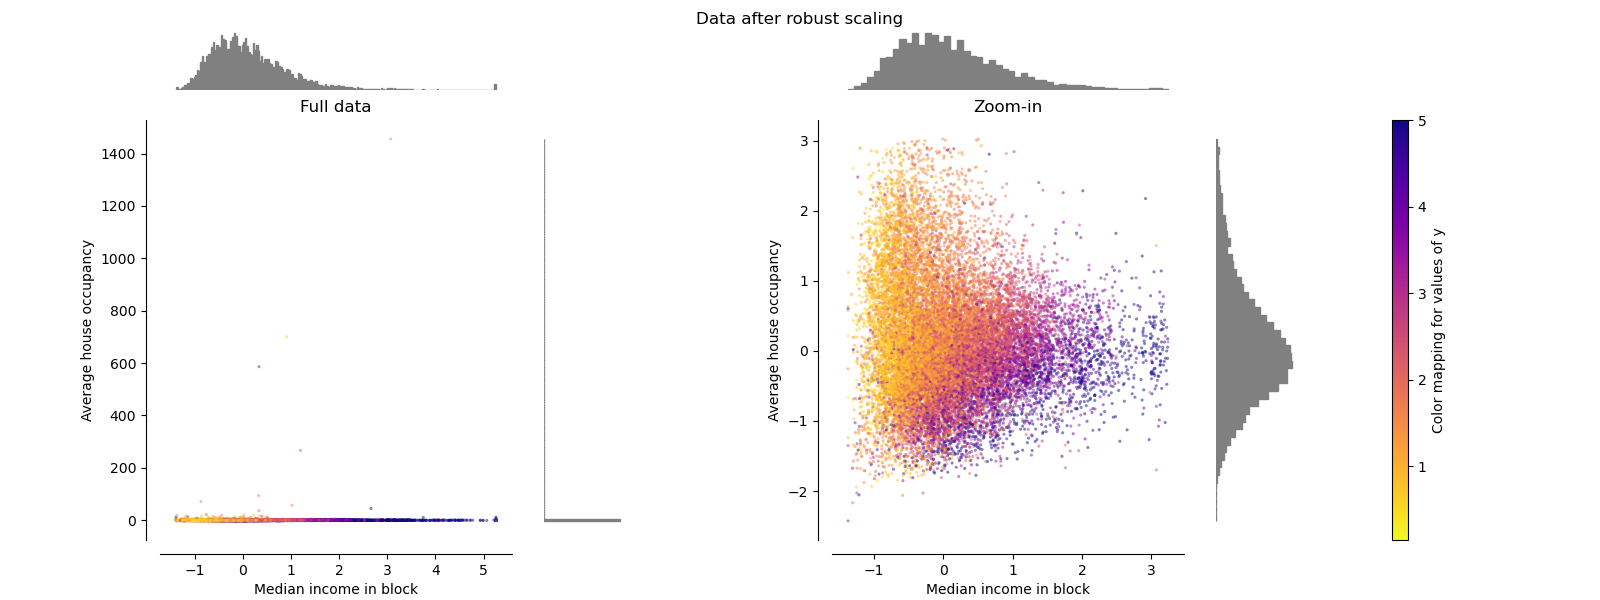
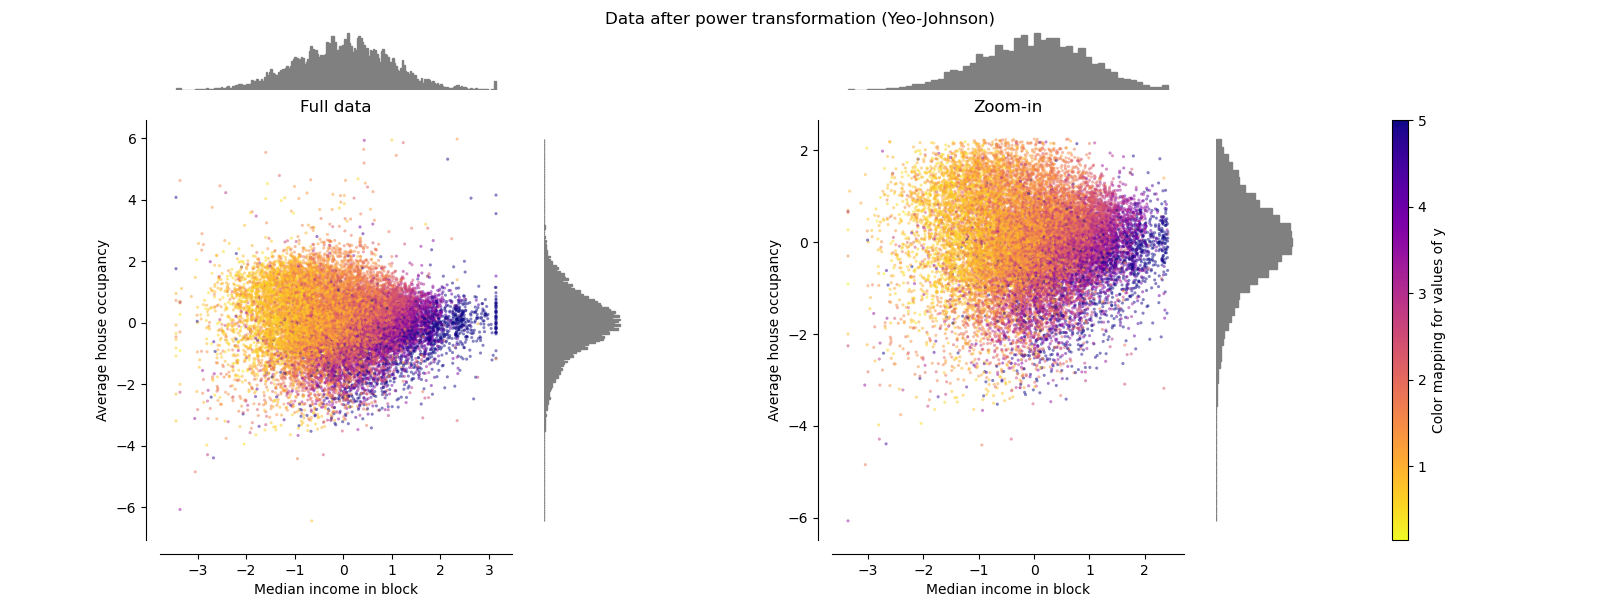
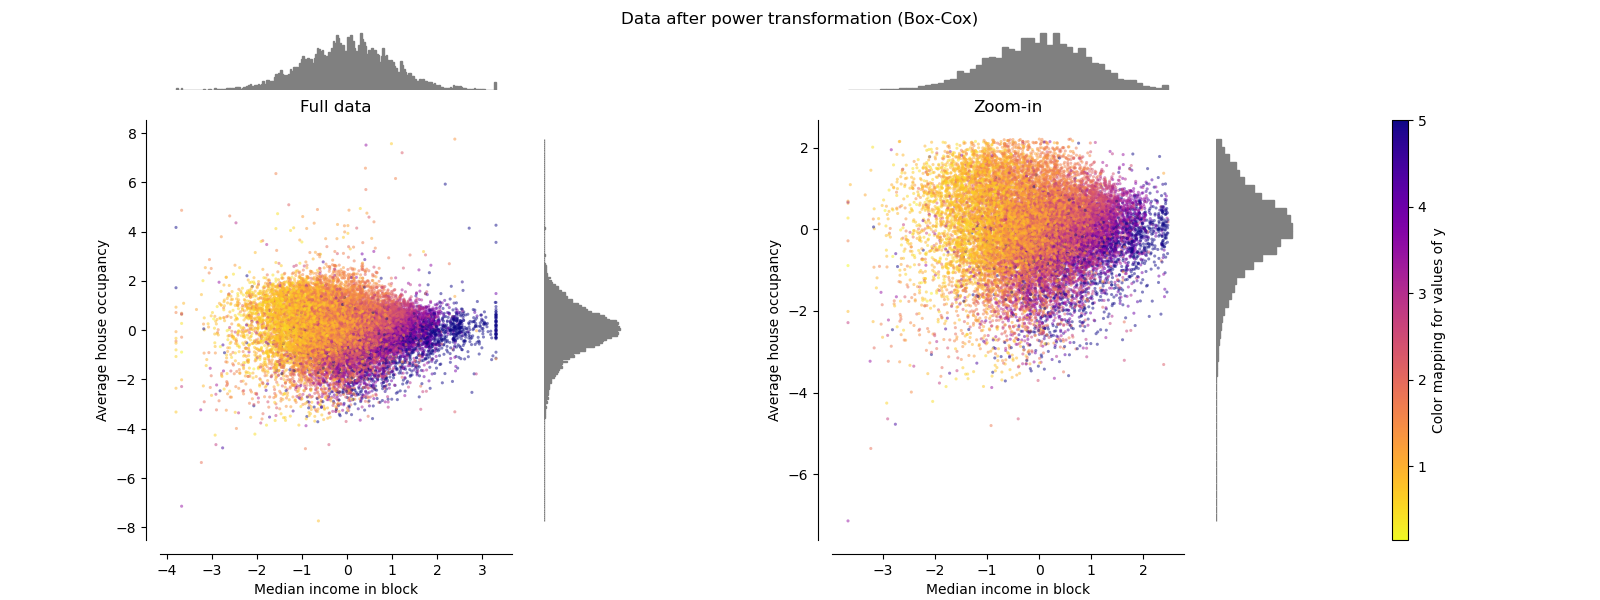
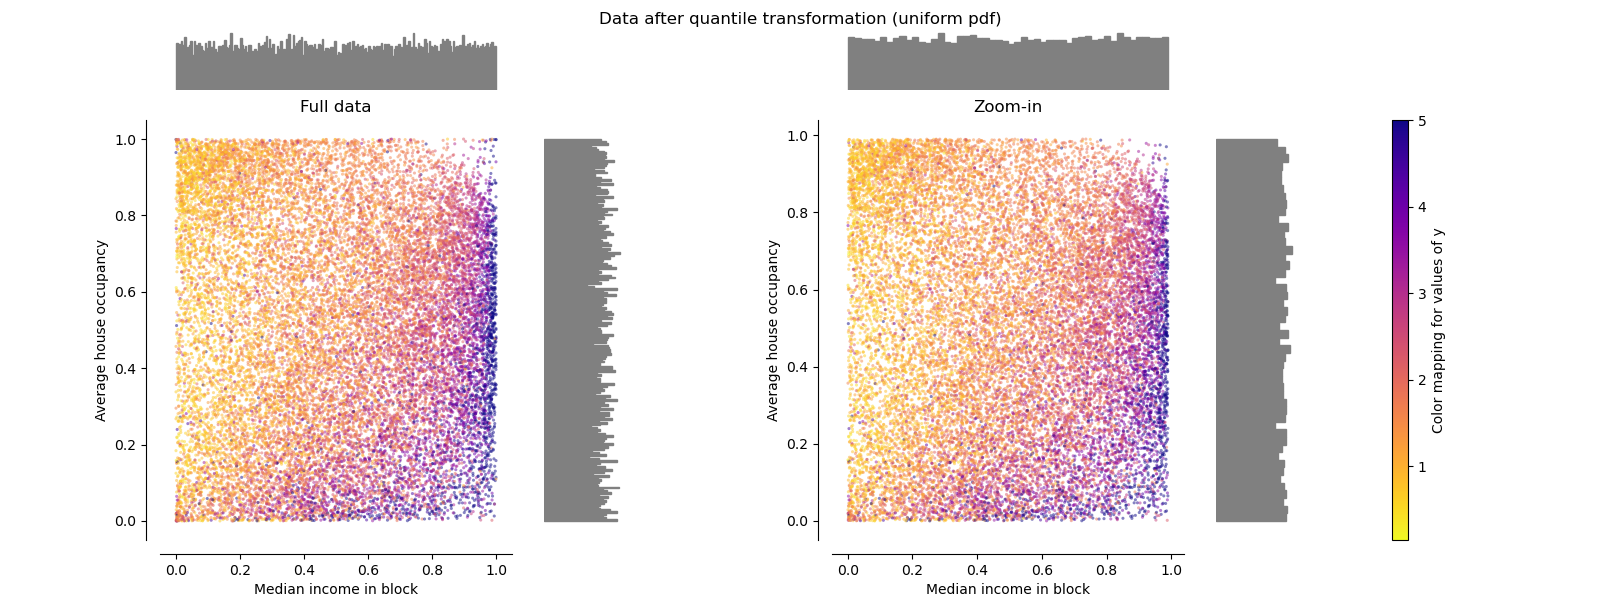
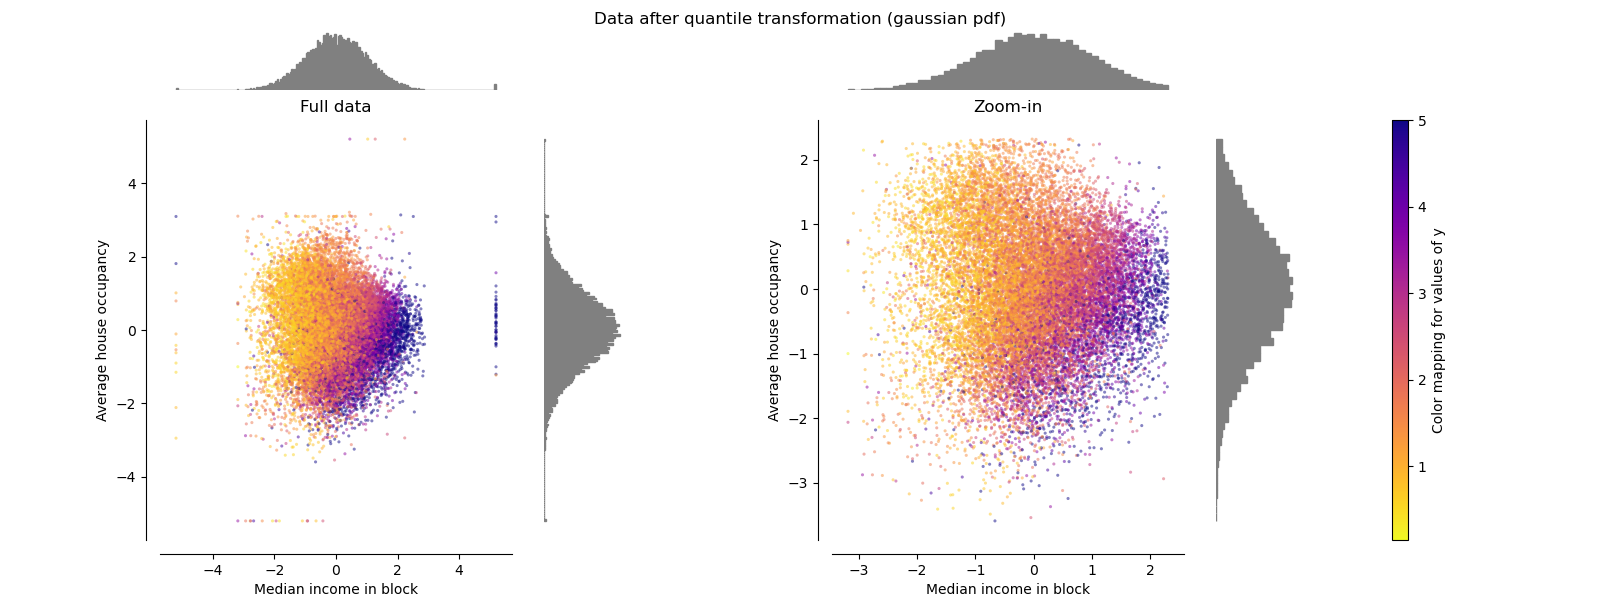
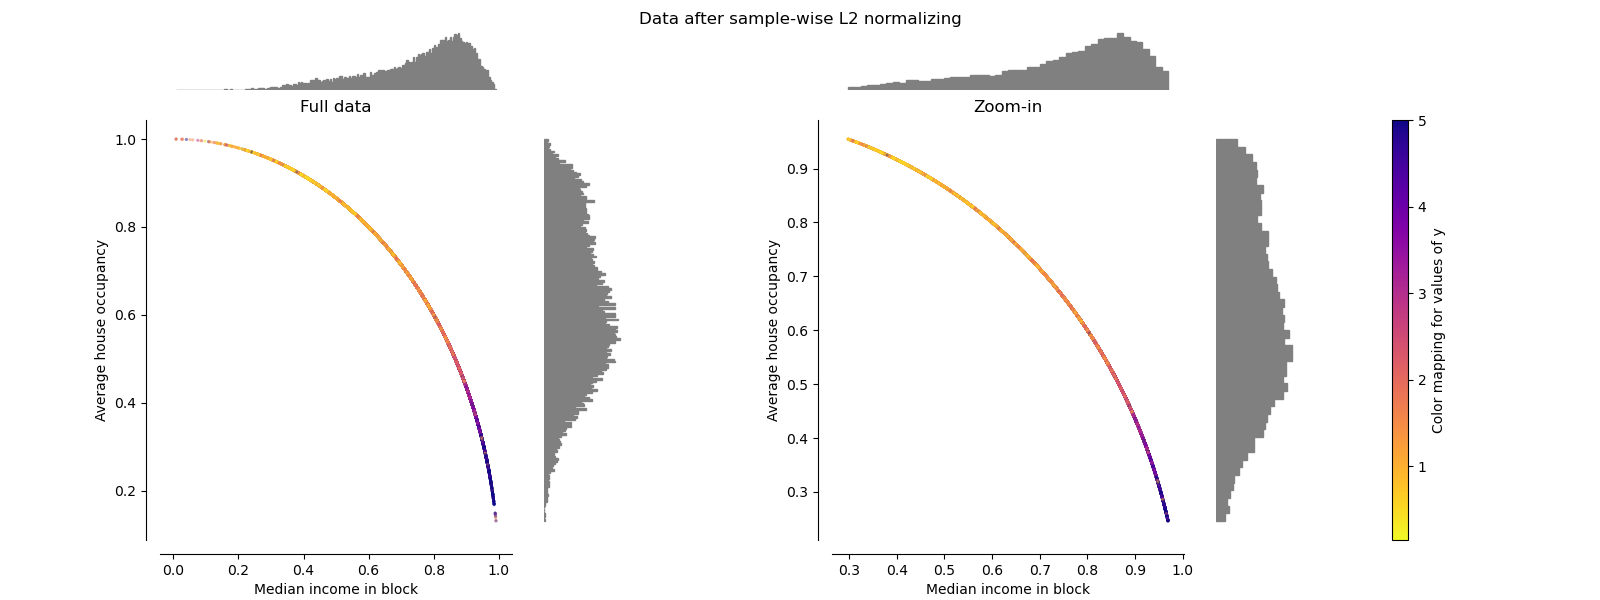
每个定标器/归一化器/变压器将显示两个图。 左图将显示完整数据集的散布图,而右图将仅考虑数据集的99%排除极值,不包括边缘异常值。 此外,每个特征的边际分布将显示在散点图的侧面。
def make_plot(item_idx):
    title, X = distributions[item_idx]
    ax_zoom_out, ax_zoom_in, ax_colorbar = create_axes(title)
    axarr = (ax_zoom_out, ax_zoom_in)
    plot_distribution(axarr[0], X, y, hist_nbins=200,
                      x0_label="Median Income",
                      x1_label="Number of households",
                      title="Full data")

    # 放缩
    zoom_in_percentile_range = (0, 99)
    cutoffs_X0 = np.percentile(X[:, 0], zoom_in_percentile_range)
    cutoffs_X1 = np.percentile(X[:, 1], zoom_in_percentile_range)

    non_outliers_mask = (
        np.all(X > [cutoffs_X0[0], cutoffs_X1[0]], axis=1) &
        np.all(X < [cutoffs_X0[1], cutoffs_X1[1]], axis=1))
    plot_distribution(axarr[1], X[non_outliers_mask], y[non_outliers_mask],
                      hist_nbins=50,
                      x0_label="Median Income",
                      x1_label="Number of households",
                      title="Zoom-in")

    norm = mpl.colors.Normalize(y_full.min(), y_full.max())
    mpl.colorbar.ColorbarBase(ax_colorbar, cmap=cmap,
                              norm=norm, orientation='vertical',
                              label='Color mapping for values of y')
原始数据 Original Data
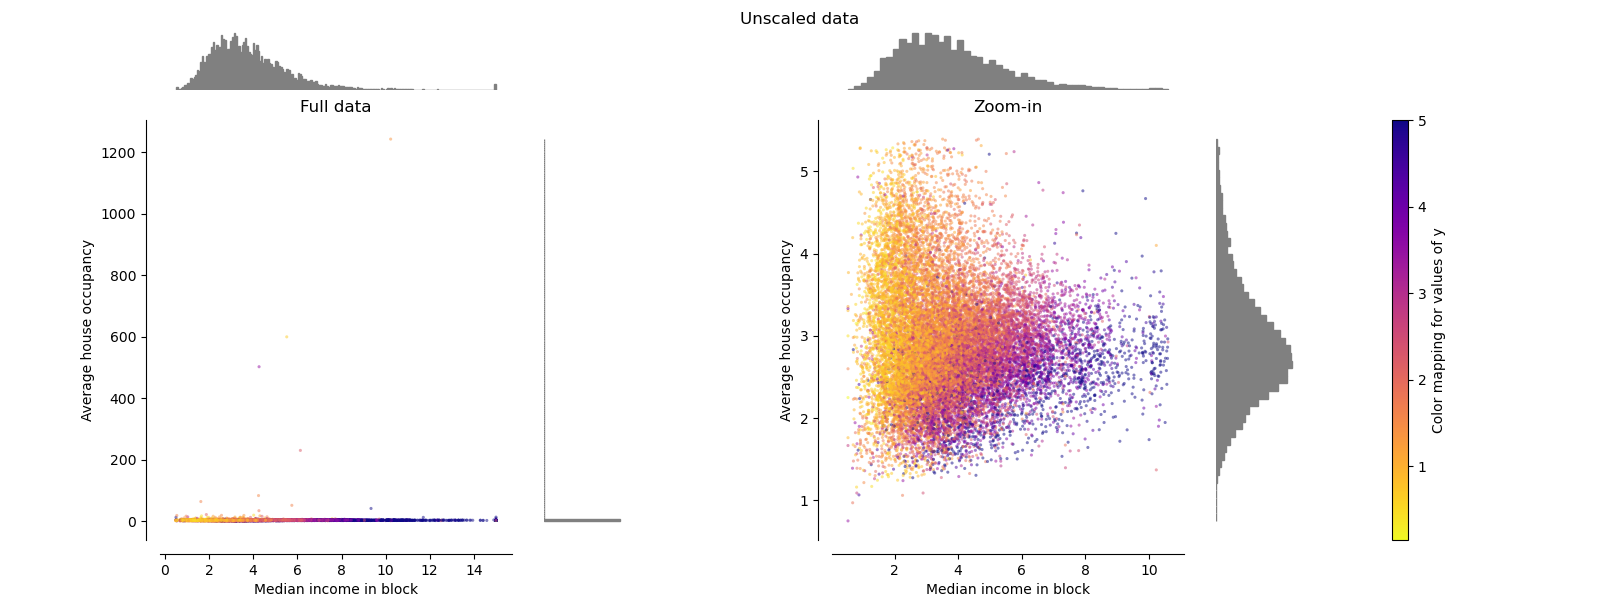
绘制每个变换以显示两个变换后的特征,左图显示整个数据集,右图放大以显示没有边缘异常值的数据集。 大部分样本被压缩到特定范围,中位数收入为[0,10],家庭数量为[0,6]。 请注意,有一些边缘异常值(一些街区有1200多个家庭)。 因此,取决于应用,特定的预处理可能会非常有益。 在下文中,我们介绍了在存在边缘异常值的情况下这些预处理方法的一些见解和行为。
make_plot(0)
标准缩放器 Standard Scaler
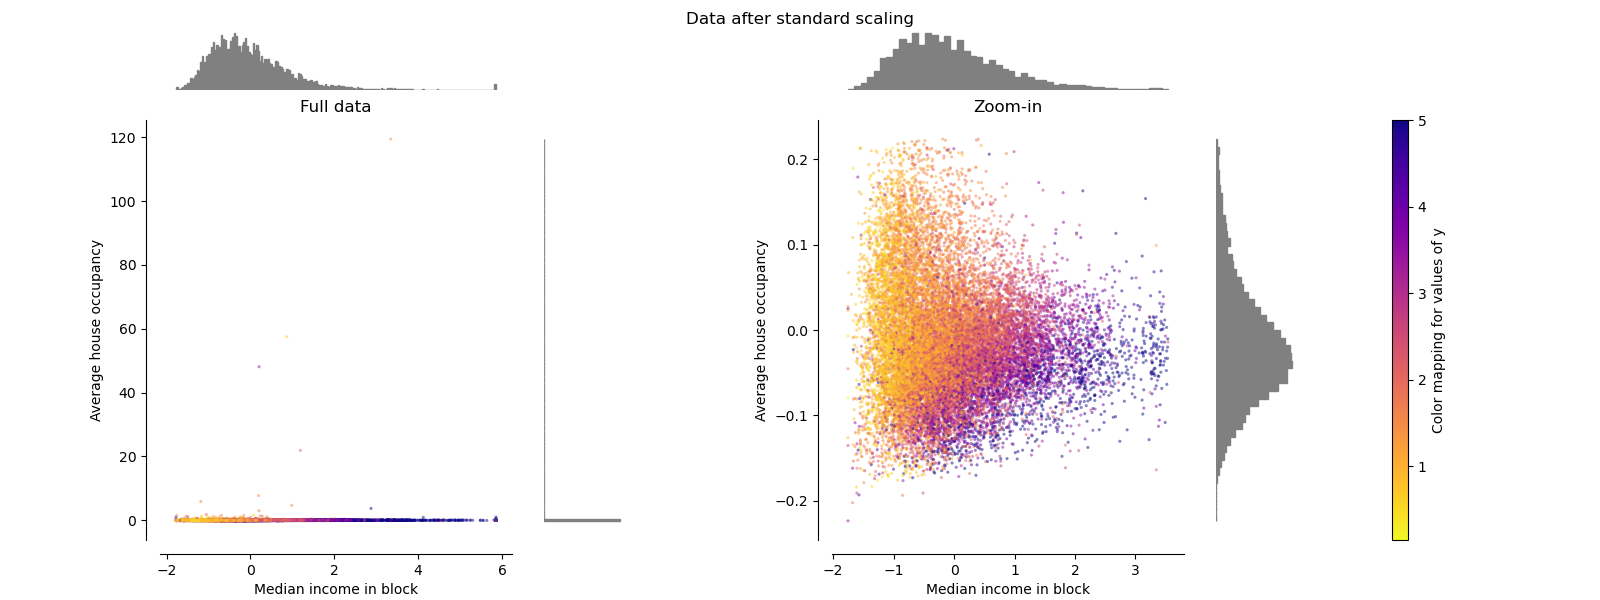
StandardScaler去除均值并将数据缩放为单位方差。 但是,异常值在计算经验均值和标准偏差时会产生影响,这会缩小特征值的范围,如下图左图所示。 特别要注意的是,由于每个要素的离群值具有不同的大小,因此每个要素上的转换数据的分布差异很大:大多数数据位于转换后的中位数收入要素的[-2,4]范围内,而相同 对于转换后的家庭数,数据被压缩在较小的[-0.2,0.2]范围内。
因此,在存在异常值的情况下,StandardScaler无法保证平衡的要素比例。
make_plot(1)
极值缩放器 MinMaxScaler
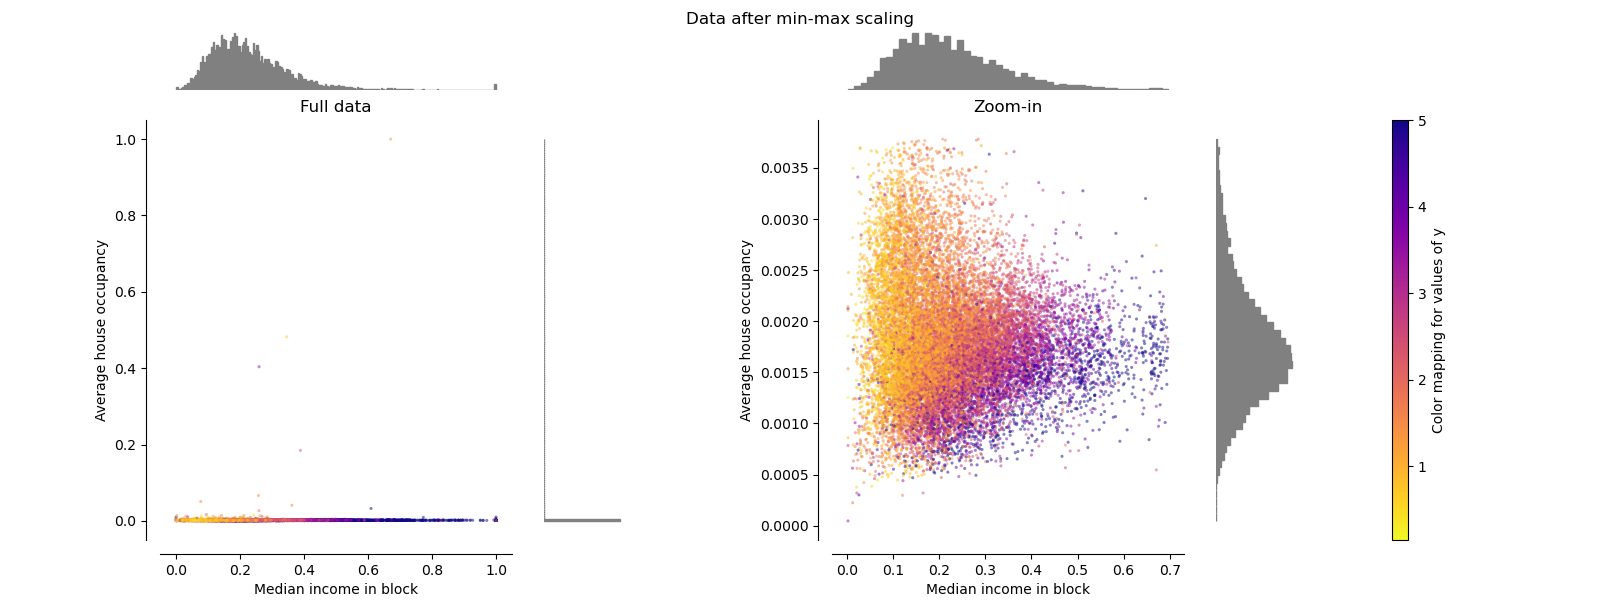
MinMaxScaler重新缩放数据集,以使所有要素值都在[0,1]范围内,如下右面板所示。 但是,对于换算后的家庭数,此缩放将所有inlier压缩在较窄的范围[0,0.005]中。
作为StandardScaler,MinMaxScaler对异常值的存在非常敏感。
make_plot(2)
最大绝对值缩放器 MaxAbsScaler
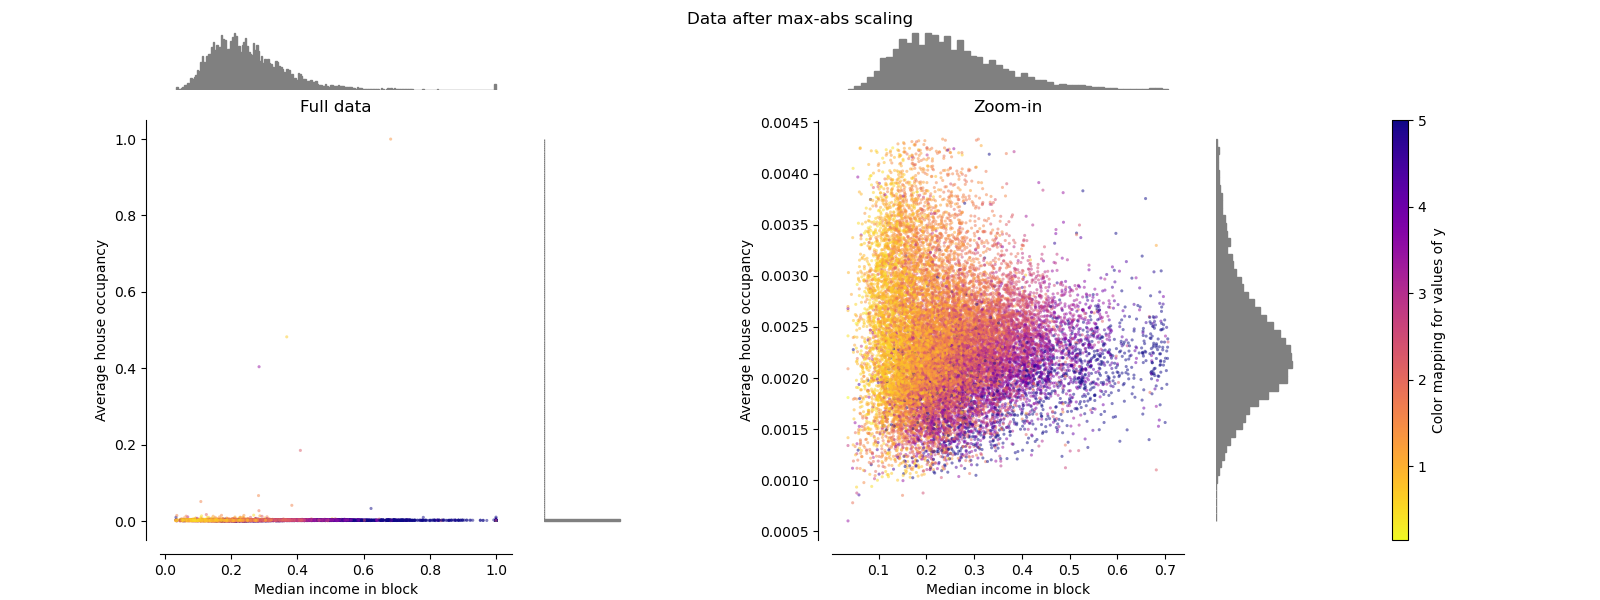
MaxAbsScaler与以前的缩放器不同,因此绝对值映射在[0,1]范围内。 在仅正数数据上,此缩放器的行为类似于MinMaxScaler,因此也存在较大的异常值。
make_plot(3)
鲁棒缩放器 RobustScaler
与以前的缩放器不同,此缩放器的居中和缩放统计信息基于百分位数,因此不受少数几个非常大的边缘异常值的影响。 因此,转换后的特征值的结果范围比以前的缩放器大,并且更重要的是,近似相似:对于两个特征,大多数缩放后的值都在[-2,3]范围内,如缩放 在图中。 注意,异常值本身仍然存在于转换后的数据中。 如果需要单独的离群裁剪,则需要进行非线性变换(请参见下文)。
make_plot(4)
幂转换器 PowerTransformer
PowerTransformer对每个功能都进行功率转换,以使数据更像高斯型。 当前,PowerTransformer实现了Yeo-Johnson和Box-Cox转换。 幂变换找到最佳缩放因子,以通过最大似然估计来稳定方差并最小化偏斜度。 默认情况下,PowerTransformer还将零均值,单位方差归一化应用于转换后的输出。 请注意,Box-Cox只能应用于严格的正数据。 收入和家庭数恰好严格为正,但是如果存在负值,则应采用Yeo-Johnson转换。
make_plot(5)
make_plot(6)
分位数转化器(高斯) QuantileTransformer(Gaussian)
QuantileTransformer具有附加的output_distribution参数,该参数允许匹配高斯分布而不是均匀分布。 请注意,此非参量转换器会引入饱和伪像以获得极值。
make_plot(7)
分位数转化器(均匀) QuantileTransformer(uniform)
QuantileTransformer应用非线性变换,以便将每个特征的概率密度函数映射到均匀分布。 在这种情况下,所有数据都将被映射在[0,1]范围内,甚至是无法再与离群值区分开的离群值。
作为RobustScaler,QuantileTransformer对异常值具有鲁棒性,因为在训练集中添加或删除异常值将对保留的数据产生大致相同的变换。 但是与RobustScaler相反,QuantileTransformer还将通过将它们设置为事先定义的范围边界(0和1)来自动折叠任何异常值。
make_plot(8)
归一化 Normalizer
归一化器将每个样本的向量重新缩放为具有单位范数,而与样本的分布无关。 在下面的两个图中都可以看到,其中所有样本都映射到单位圆上。 在我们的示例中,两个选定的特征仅具有正值。 因此,转换后的数据仅位于正象限中。 如果某些原始特征混合了正值和负值,则情况并非如此。
make_plot(9)
脚本的总运行时间:(0分钟10.606秒)


