

多类Adaboost决策树
这个例子再现了 朱等人[1]的图1,并展示了如何boosting才能提升对多类问题的预测精度。分类数据集是通过采用10维标准正态分布创建的,并且定义三个类,由嵌套同心的10维球分隔,使每个类中的样本数量大致相等(分布的分位数)。
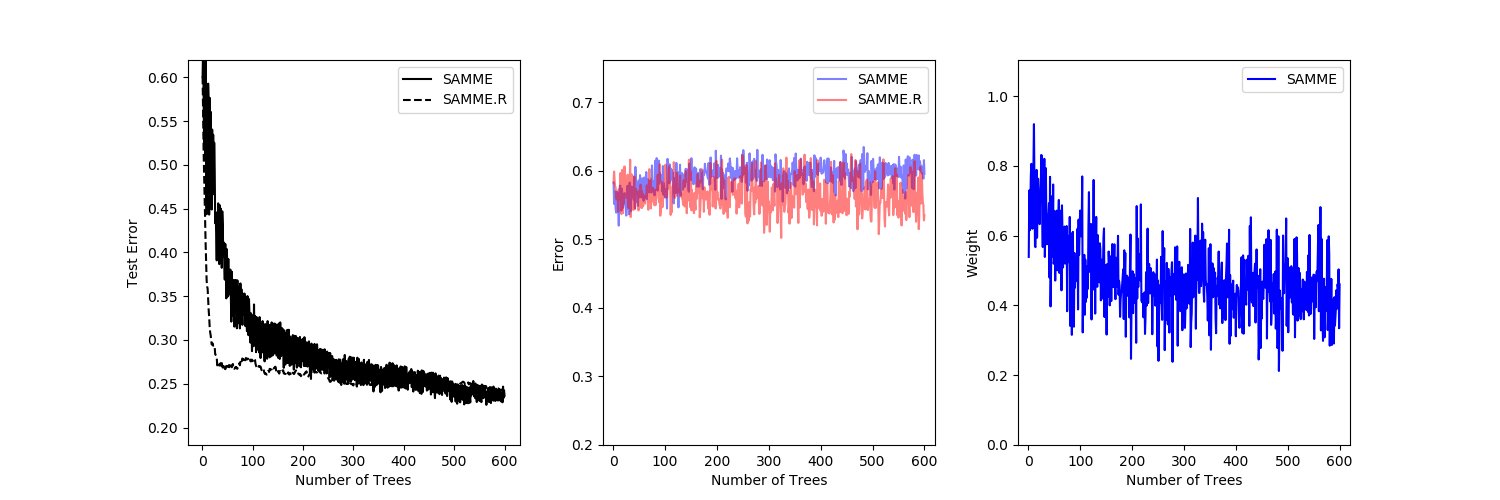
比较了SAMME算法和SAMME.R[1]算法的性能。SAMME.R使用概率估计来更新增加模型,而SAMME只使用分类。如示例所示,SAMME.R算法通常比SAMME更快地收敛,通过更少的提升迭代实现较低的测试误差。每一次提升迭代后,测试集上各算法的误差显示在左侧,每一棵树的测试集上的分类误差显示在中间,每一棵树的boost权重显示在右侧。在SAMME.R算法中,所有树的权重都是1,因此没有显示。
1(1,2) Zhu, H. Zou, S. Rosset, T. Hastie, “Multi-class AdaBoost”, 2009.
print(__doc__)

# Author: Noel Dawe <noel.dawe@gmail.com>
#
# License: BSD 3 clause

import matplotlib.pyplot as plt

from sklearn.datasets import make_gaussian_quantiles
from sklearn.ensemble import AdaBoostClassifier
from sklearn.metrics import accuracy_score
from sklearn.tree import DecisionTreeClassifier


X, y = make_gaussian_quantiles(n_samples=13000, n_features=10,
                               n_classes=3, random_state=1)

n_split = 3000

X_train, X_test = X[:n_split], X[n_split:]
y_train, y_test = y[:n_split], y[n_split:]

bdt_real = AdaBoostClassifier(
    DecisionTreeClassifier(max_depth=2),
    n_estimators=600,
    learning_rate=1)

bdt_discrete = AdaBoostClassifier(
    DecisionTreeClassifier(max_depth=2),
    n_estimators=600,
    learning_rate=1.5,
    algorithm="SAMME")

bdt_real.fit(X_train, y_train)
bdt_discrete.fit(X_train, y_train)

real_test_errors = []
discrete_test_errors = []

for real_test_predict, discrete_train_predict in zip(
        bdt_real.staged_predict(X_test), bdt_discrete.staged_predict(X_test)):
    real_test_errors.append(
        1. - accuracy_score(real_test_predict, y_test))
    discrete_test_errors.append(
        1. - accuracy_score(discrete_train_predict, y_test))

n_trees_discrete = len(bdt_discrete)
n_trees_real = len(bdt_real)

# Boosting might terminate early, but the following arrays are always
# n_estimators long. We crop them to the actual number of trees here:
discrete_estimator_errors = bdt_discrete.estimator_errors_[:n_trees_discrete]
real_estimator_errors = bdt_real.estimator_errors_[:n_trees_real]
discrete_estimator_weights = bdt_discrete.estimator_weights_[:n_trees_discrete]

plt.figure(figsize=(15, 5))

plt.subplot(131)
plt.plot(range(1, n_trees_discrete + 1),
         discrete_test_errors, c='black', label='SAMME')
plt.plot(range(1, n_trees_real + 1),
         real_test_errors, c='black',
         linestyle='dashed', label='SAMME.R')
plt.legend()
plt.ylim(0.18, 0.62)
plt.ylabel('Test Error')
plt.xlabel('Number of Trees')

plt.subplot(132)
plt.plot(range(1, n_trees_discrete + 1), discrete_estimator_errors,
         "b", label='SAMME', alpha=.5)
plt.plot(range(1, n_trees_real + 1), real_estimator_errors,
         "r", label='SAMME.R', alpha=.5)
plt.legend()
plt.ylabel('Error')
plt.xlabel('Number of Trees')
plt.ylim((.2,
         max(real_estimator_errors.max(),
             discrete_estimator_errors.max()) * 1.2))
plt.xlim((-20, len(bdt_discrete) + 20))

plt.subplot(133)
plt.plot(range(1, n_trees_discrete + 1), discrete_estimator_weights,
         "b", label='SAMME')
plt.legend()
plt.ylabel('Weight')
plt.xlabel('Number of Trees')
plt.ylim((0, discrete_estimator_weights.max() * 1.2))
plt.xlim((-20, n_trees_discrete + 20))

# prevent overlapping y-axis labels
plt.subplots_adjust(wspace=0.25)
plt.show()
脚本的总运行时间:(0分14.367秒)

