

支持向量机的练习
使用不同的SVM内核的教程练习。
该练习在“有监督的学习”的“使用内核”部分中进行了使用:“从用于科学数据处理的统计学习教程”的高维观察部分预测输出变量。
import numpy as np
import matplotlib.pyplot as plt
from sklearn import datasets, svm
iris = datasets.load_iris()
X = iris.data
y = iris.target
X = X[y != 0, :2]
y = y[y != 0]
n_sample = len(X)
np.random.seed(0)
order = np.random.permutation(n_sample)
X = X[order]
y = y[order].astype(np.float)
X_train = X[:int(.9 * n_sample)]
y_train = y[:int(.9 * n_sample)]
X_test = X[int(.9 * n_sample):]
y_test = y[int(.9 * n_sample):]
# fit the model
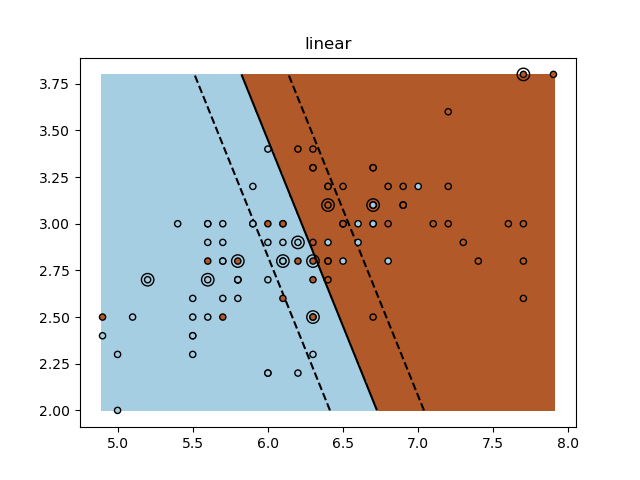
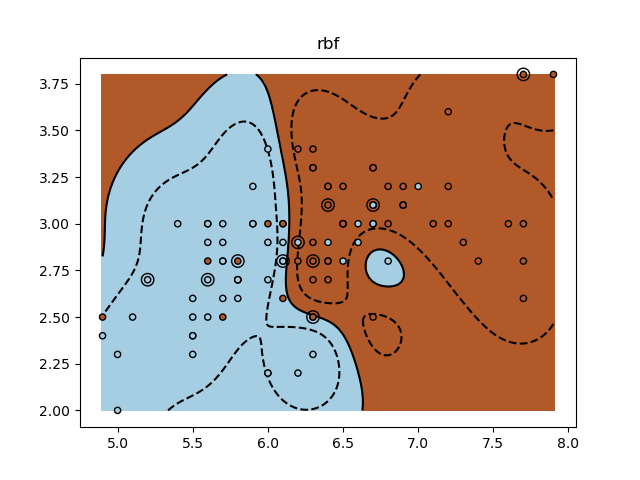
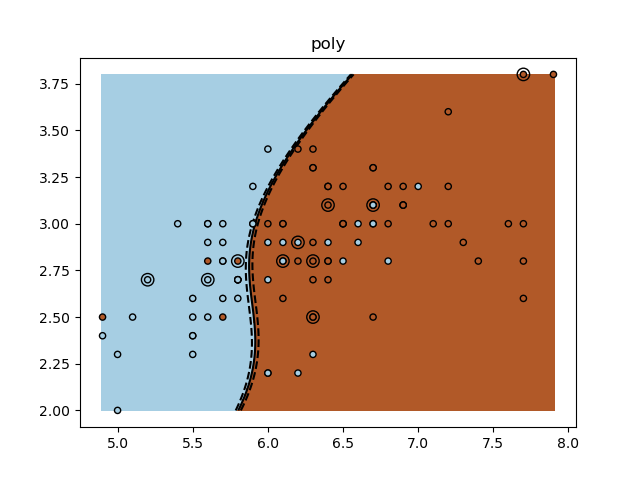
for kernel in ('linear', 'rbf', 'poly'):
clf = svm.SVC(kernel=kernel, gamma=10)
clf.fit(X_train, y_train)
plt.figure()
plt.clf()
plt.scatter(X[:, 0], X[:, 1], c=y, zorder=10, cmap=plt.cm.Paired,
edgecolor='k', s=20)
# Circle out the test data
plt.scatter(X_test[:, 0], X_test[:, 1], s=80, facecolors='none',
zorder=10, edgecolor='k')
plt.axis('tight')
x_min = X[:, 0].min()
x_max = X[:, 0].max()
y_min = X[:, 1].min()
y_max = X[:, 1].max()
XX, YY = np.mgrid[x_min:x_max:200j, y_min:y_max:200j]
Z = clf.decision_function(np.c_[XX.ravel(), YY.ravel()])
# Put the result into a color plot
Z = Z.reshape(XX.shape)
plt.pcolormesh(XX, YY, Z > 0, cmap=plt.cm.Paired)
plt.contour(XX, YY, Z, colors=['k', 'k', 'k'],
linestyles=['--', '-', '--'], levels=[-.5, 0, .5])
plt.title(kernel)
plt.show()
输出:
脚本的总运行时间:0分钟6.891秒

