

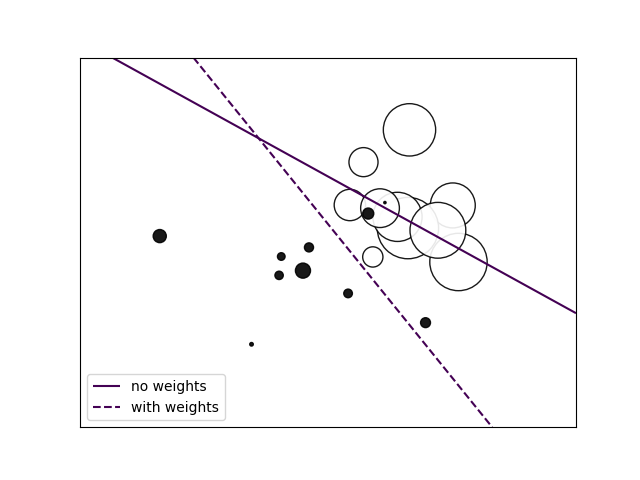
SGD:加权样本
绘制加权数据集的决策函数, 其中点的大小与其权重成正比。
print(__doc__)

import numpy as np
import matplotlib.pyplot as plt
from sklearn import linear_model

# we create 20 points
np.random.seed(0)
X = np.r_[np.random.randn(10, 2) + [1, 1], np.random.randn(10, 2)]
y = [1] * 10 + [-1] * 10
sample_weight = 100 * np.abs(np.random.randn(20))
# and assign a bigger weight to the last 10 samples
sample_weight[:10] *= 10

# plot the weighted data points
xx, yy = np.meshgrid(np.linspace(-4, 5, 500), np.linspace(-4, 5, 500))
plt.figure()
plt.scatter(X[:, 0], X[:, 1], c=y, s=sample_weight, alpha=0.9,
            cmap=plt.cm.bone, edgecolor='black')

# fit the unweighted model
clf = linear_model.SGDClassifier(alpha=0.01, max_iter=100)
clf.fit(X, y)
Z = clf.decision_function(np.c_[xx.ravel(), yy.ravel()])
Z = Z.reshape(xx.shape)
no_weights = plt.contour(xx, yy, Z, levels=[0], linestyles=['solid'])

# fit the weighted model
clf = linear_model.SGDClassifier(alpha=0.01, max_iter=100)
clf.fit(X, y, sample_weight=sample_weight)
Z = clf.decision_function(np.c_[xx.ravel(), yy.ravel()])
Z = Z.reshape(xx.shape)
samples_weights = plt.contour(xx, yy, Z, levels=[0], linestyles=['dashed'])

plt.legend([no_weights.collections[0], samples_weights.collections[0]],
           ["no weights", "with weights"], loc="lower left")

plt.xticks(())
plt.yticks(())
plt.show()
脚本的总运行时间:(0分0.074秒)

