

在区域内分割希腊硬币的图片
此示例在图像上从体素到体素差值生成的图形上使用光谱聚类将图像分割为多个部分同质的区域。
这种过程(图像上的光谱聚类)是找到归一化图割集的一种有效的近似解。
有两个选项可指定标签:
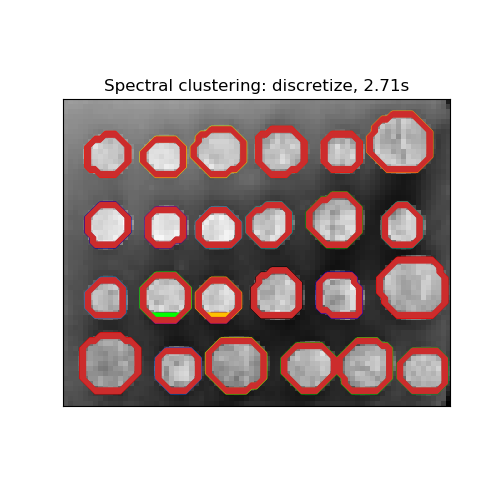
使用“kmeans”,光谱聚类将使用kmeans算法在嵌入空间中对样本进行聚类。 而“‘discrete’”, 将迭代搜索与嵌入空间最接近的分区空间。
print(__doc__)

# Author: Gael Varoquaux <gael.varoquaux@normalesup.org>, Brian Cheung
# License: BSD 3 clause

import time

import numpy as np
from distutils.version import LooseVersion
from scipy.ndimage.filters import gaussian_filter
import matplotlib.pyplot as plt
import skimage
from skimage.data import coins
from skimage.transform import rescale

from sklearn.feature_extraction import image
from sklearn.cluster import spectral_clustering

# these were introduced in skimage-0.14
if LooseVersion(skimage.__version__) >= '0.14':
    rescale_params = {'anti_aliasing': False, 'multichannel': False}
else:
    rescale_params = {}

# load the coins as a numpy array
orig_coins = coins()

# Resize it to 20% of the original size to speed up the processing
# Applying a Gaussian filter for smoothing prior to down-scaling
# reduces aliasing artifacts.
smoothened_coins = gaussian_filter(orig_coins, sigma=2)
rescaled_coins = rescale(smoothened_coins, 0.2, mode="reflect",
                         **rescale_params)

# Convert the image into a graph with the value of the gradient on the
# edges.
graph = image.img_to_graph(rescaled_coins)

# Take a decreasing function of the gradient: an exponential
# The smaller beta is, the more independent the segmentation is of the
# actual image. For beta=1, the segmentation is close to a voronoi
beta = 10
eps = 1e-6
graph.data = np.exp(-beta * graph.data / graph.data.std()) + eps

# Apply spectral clustering (this step goes much faster if you have pyamg
# installed)
N_REGIONS = 25
Visualize the resulting regions

for assign_labels in ('kmeans', 'discretize'):
    t0 = time.time()
    labels = spectral_clustering(graph, n_clusters=N_REGIONS,
                                 assign_labels=assign_labels, random_state=42)
    t1 = time.time()
    labels = labels.reshape(rescaled_coins.shape)

    plt.figure(figsize=(5, 5))
    plt.imshow(rescaled_coins, cmap=plt.cm.gray)
    for l in range(N_REGIONS):
        plt.contour(labels == l,
                    colors=[plt.cm.nipy_spectral(l / float(N_REGIONS))])
    plt.xticks(())
    plt.yticks(())
    title = 'Spectral clustering: %s, %.2fs' % (assign_labels, (t1 - t0))
    print(title)
    plt.title(title)
plt.show()
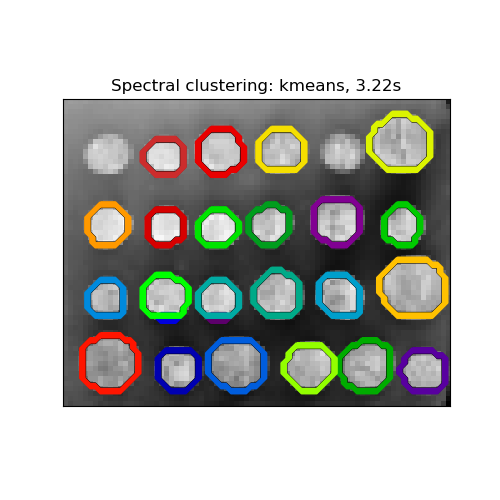
Spectral clustering: kmeans, 3.22s
Spectral clustering: discretize, 2.71s
脚本的总运行时间:(0分6.573秒)

