

比较有邻域成分分析与无邻域成分分析的最近邻域
本案例比较了有领域成分分析和无领域成分分析的两种最近邻分类算法。
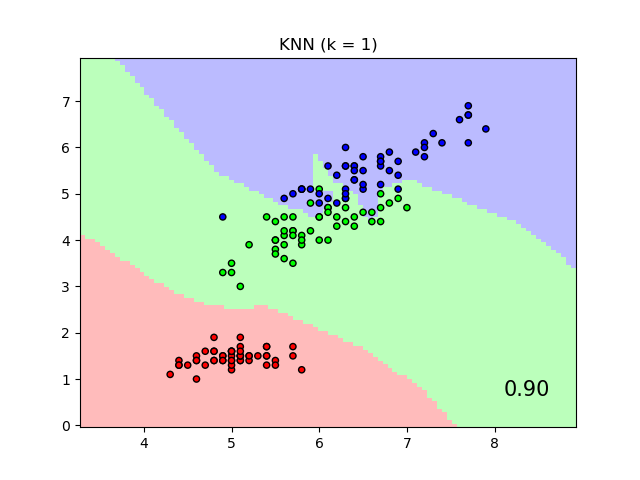
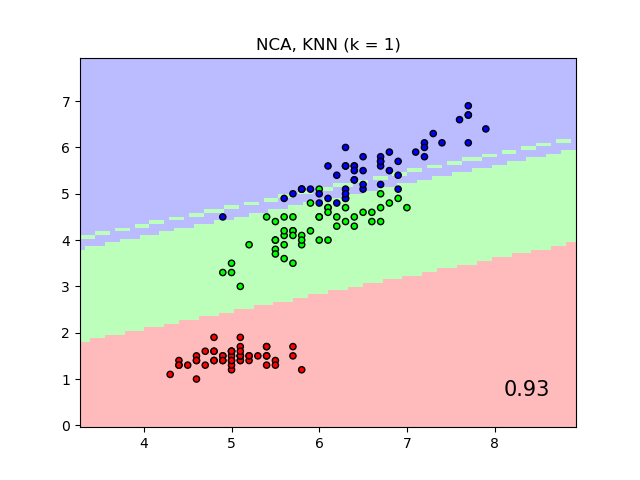
当在原始特征上使用欧几里得距离时,它将使用最近邻分类器给出的标签类别的决策边界作图,而不是通过邻域成分分析学习到的变换后的欧几里得距离作图。后者的目的是找到一个线性变换,以最大化训练集上的(随机)最近邻分类精度。
输入:
# 执照: BSD 3 clause

import numpy as np
import matplotlib.pyplot as plt
from matplotlib.colors import ListedColormap
from sklearn import datasets
from sklearn.model_selection import train_test_split
from sklearn.preprocessing import StandardScaler
from sklearn.neighbors import (KNeighborsClassifier,
                               NeighborhoodComponentsAnalysis)
from sklearn.pipeline import Pipeline


print(__doc__)

n_neighbors = 1

dataset = datasets.load_iris()
X, y = dataset.data, dataset.target

# 我们只使用两个特征,以此来避免必须使用复杂的切片
X = X[:, [0, 2]]

X_train, X_test, y_train, y_test = \
    train_test_split(X, y, stratify=y, test_size=0.7, random_state=42)

h = .01  # 网格中的步长

# 创建色谱
cmap_light = ListedColormap(['#FFAAAA', '#AAFFAA', '#AAAAFF'])
cmap_bold = ListedColormap(['#FF0000', '#00FF00', '#0000FF'])

names = ['KNN', 'NCA, KNN']

classifiers = [Pipeline([('scaler', StandardScaler()),
                         ('knn', KNeighborsClassifier(n_neighbors=n_neighbors))
                         ]),
               Pipeline([('scaler', StandardScaler()),
                         ('nca', NeighborhoodComponentsAnalysis()),
                         ('knn', KNeighborsClassifier(n_neighbors=n_neighbors))
                         ])
               ]

x_min, x_max = X[:, 0].min() - 1, X[:, 0].max() + 1
y_min, y_max = X[:, 1].min() - 1, X[:, 1].max() + 1
xx, yy = np.meshgrid(np.arange(x_min, x_max, h),
                     np.arange(y_min, y_max, h))

for name, clf in zip(names, classifiers):

    clf.fit(X_train, y_train)
    score = clf.score(X_test, y_test)

    # 绘制决策边界。为此,我们将为网格[x_min,x_max] x [y_min,y_max]中的每个点分配颜色。
    Z = clf.predict(np.c_[xx.ravel(), yy.ravel()])

    # 将结果放入颜色盘
    Z = Z.reshape(xx.shape)
    plt.figure()
    plt.pcolormesh(xx, yy, Z, cmap=cmap_light, alpha=.8)

    # 还要绘制训练和测试点
    plt.scatter(X[:, 0], X[:, 1], c=y, cmap=cmap_bold, edgecolor='k', s=20)
    plt.xlim(xx.min(), xx.max())
    plt.ylim(yy.min(), yy.max())
    plt.title("{} (k = {})".format(name, n_neighbors))
    plt.text(0.9, 0.1, '{:.2f}'.format(score), size=15,
             ha='center', va='center', transform=plt.gca().transAxes)

plt.show()
脚本的总运行时间:(0分钟21.280秒)

