

梯度提升袋外估计
袋外(OOB)估计是估计“最优”提升迭代次数的一种有用的启发式方法。OOB估计与交叉验证估计几乎相同,但它们可以在不需要重复模型拟合的情况下实时计算。OOB估计仅适用于随机梯度提升(即 subsample < 1.0),这些估计是基于Bootstrap样本中未包括的样本(所谓的“袋外样本”)的损失改进而得到的。OOB估计是对真实测试损失的一种悲观估计,但对于少量的树仍然是一个相当好的近似。
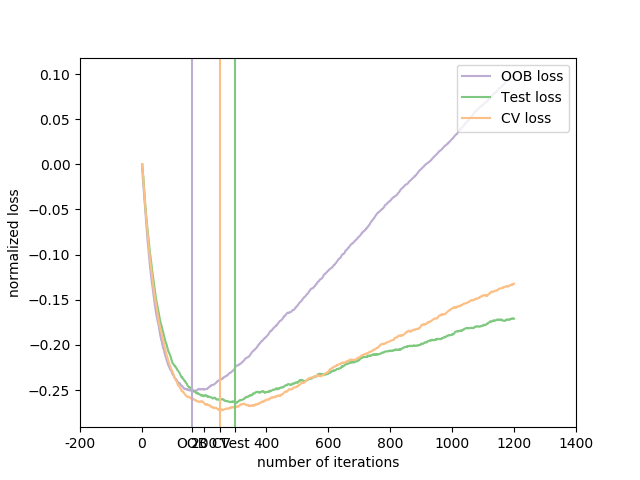
该图显示负OOB改进的累积和作为Boost迭代的函数。如您所见,它跟踪前100次迭代的测试损失,但随后以悲观的方式发散。图中还显示了3倍交叉验证的性能,这通常能更好地估计测试损失,但在计算上要求更高。
Accuracy: 0.6840
print(__doc__)

# Author: Peter Prettenhofer <peter.prettenhofer@gmail.com>
#
# License: BSD 3 clause

import numpy as np
import matplotlib.pyplot as plt

from sklearn import ensemble
from sklearn.model_selection import KFold
from sklearn.model_selection import train_test_split

from scipy.special import expit

# Generate data (adapted from G. Ridgeway's gbm example)
n_samples = 1000
random_state = np.random.RandomState(13)
x1 = random_state.uniform(size=n_samples)
x2 = random_state.uniform(size=n_samples)
x3 = random_state.randint(0, 4, size=n_samples)

p = expit(np.sin(3 * x1) - 4 * x2 + x3)
y = random_state.binomial(1, p, size=n_samples)

X = np.c_[x1, x2, x3]

X = X.astype(np.float32)
X_train, X_test, y_train, y_test = train_test_split(X, y, test_size=0.5,
                                                    random_state=9)

# Fit classifier with out-of-bag estimates
params = {'n_estimators': 1200, 'max_depth': 3, 'subsample': 0.5,
          'learning_rate': 0.01, 'min_samples_leaf': 1, 'random_state': 3}
clf = ensemble.GradientBoostingClassifier(**params)

clf.fit(X_train, y_train)
acc = clf.score(X_test, y_test)
print("Accuracy: {:.4f}".format(acc))

n_estimators = params['n_estimators']
x = np.arange(n_estimators) + 1


def heldout_score(clf, X_test, y_test):
    """compute deviance scores on ``X_test`` and ``y_test``. """
    score = np.zeros((n_estimators,), dtype=np.float64)
    for i, y_pred in enumerate(clf.staged_decision_function(X_test)):
        score[i] = clf.loss_(y_test, y_pred)
    return score


def cv_estimate(n_splits=None):
    cv = KFold(n_splits=n_splits)
    cv_clf = ensemble.GradientBoostingClassifier(**params)
    val_scores = np.zeros((n_estimators,), dtype=np.float64)
    for train, test in cv.split(X_train, y_train):
        cv_clf.fit(X_train[train], y_train[train])
        val_scores += heldout_score(cv_clf, X_train[test], y_train[test])
    val_scores /= n_splits
    return val_scores


# Estimate best n_estimator using cross-validation
cv_score = cv_estimate(3)

# Compute best n_estimator for test data
test_score = heldout_score(clf, X_test, y_test)

# negative cumulative sum of oob improvements
cumsum = -np.cumsum(clf.oob_improvement_)

# min loss according to OOB
oob_best_iter = x[np.argmin(cumsum)]

# min loss according to test (normalize such that first loss is 0)
test_score -= test_score[0]
test_best_iter = x[np.argmin(test_score)]

# min loss according to cv (normalize such that first loss is 0)
cv_score -= cv_score[0]
cv_best_iter = x[np.argmin(cv_score)]

# color brew for the three curves
oob_color = list(map(lambda x: x / 256.0, (190, 174, 212)))
test_color = list(map(lambda x: x / 256.0, (127, 201, 127)))
cv_color = list(map(lambda x: x / 256.0, (253, 192, 134)))

# plot curves and vertical lines for best iterations
plt.plot(x, cumsum, label='OOB loss', color=oob_color)
plt.plot(x, test_score, label='Test loss', color=test_color)
plt.plot(x, cv_score, label='CV loss', color=cv_color)
plt.axvline(x=oob_best_iter, color=oob_color)
plt.axvline(x=test_best_iter, color=test_color)
plt.axvline(x=cv_best_iter, color=cv_color)

# add three vertical lines to xticks
xticks = plt.xticks()
xticks_pos = np.array(xticks[0].tolist() +
                      [oob_best_iter, cv_best_iter, test_best_iter])
xticks_label = np.array(list(map(lambda t: int(t), xticks[0])) +
                        ['OOB', 'CV', 'Test'])
ind = np.argsort(xticks_pos)
xticks_pos = xticks_pos[ind]
xticks_label = xticks_label[ind]
plt.xticks(xticks_pos, xticks_label)

plt.legend(loc='upper right')
plt.ylabel('normalized loss')
plt.xlabel('number of iterations')

plt.show()
脚本的总运行时间:(0分4.348秒)

