

梯度提升正则
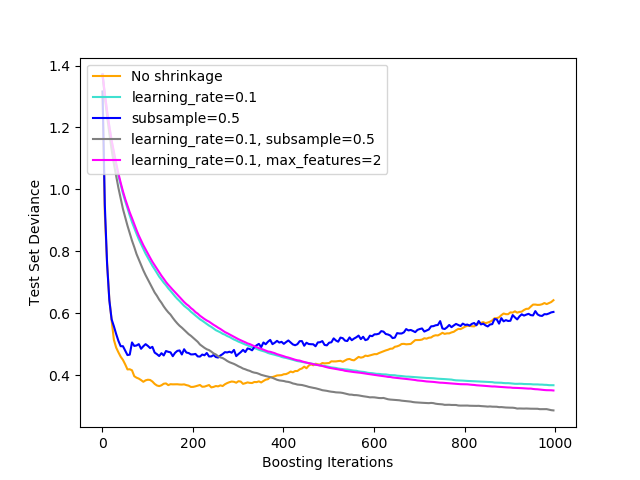
不同正则化策略对梯度提升效果的说明。这个例子来源于 Hastie et al 2009 [1]。
所使用的损失函数是二项偏差。通过收缩进行正则化(learning_rate < 1.0)大大提高了性能。结合收缩,随机梯度提升 (subsample < 1.0)可以通过bagging降低方差来产生更精确的模型。不收缩的子采样通常效果不佳。另一种降低方差的策略是对类似于随机森林中的随机分裂的特征进行子采样(通过max_features参数)。
1 T. Hastie, R. Tibshirani and J. Friedman, “Elements of Statistical Learning Ed. 2”, Springer, 2009.
print(__doc__)

# Author: Peter Prettenhofer <peter.prettenhofer@gmail.com>
#
# License: BSD 3 clause

import numpy as np
import matplotlib.pyplot as plt

from sklearn import ensemble
from sklearn import datasets


X, y = datasets.make_hastie_10_2(n_samples=12000, random_state=1)
X = X.astype(np.float32)

# map labels from {-1, 1} to {0, 1}
labels, y = np.unique(y, return_inverse=True)

X_train, X_test = X[:2000], X[2000:]
y_train, y_test = y[:2000], y[2000:]

original_params = {'n_estimators': 1000, 'max_leaf_nodes': 4, 'max_depth': None, 'random_state': 2,
                   'min_samples_split': 5}

plt.figure()

for label, color, setting in [('No shrinkage', 'orange',
                               {'learning_rate': 1.0, 'subsample': 1.0}),
                              ('learning_rate=0.1', 'turquoise',
                               {'learning_rate': 0.1, 'subsample': 1.0}),
                              ('subsample=0.5', 'blue',
                               {'learning_rate': 1.0, 'subsample': 0.5}),
                              ('learning_rate=0.1, subsample=0.5', 'gray',
                               {'learning_rate': 0.1, 'subsample': 0.5}),
                              ('learning_rate=0.1, max_features=2', 'magenta',
                               {'learning_rate': 0.1, 'max_features': 2})]:
    params = dict(original_params)
    params.update(setting)

    clf = ensemble.GradientBoostingClassifier(**params)
    clf.fit(X_train, y_train)

    # compute test set deviance
    test_deviance = np.zeros((params['n_estimators'],), dtype=np.float64)

    for i, y_pred in enumerate(clf.staged_decision_function(X_test)):
        # clf.loss_ assumes that y_test[i] in {0, 1}
        test_deviance[i] = clf.loss_(y_test, y_pred)

    plt.plot((np.arange(test_deviance.shape[0]) + 1)[::5], test_deviance[::5],
            '-', color=color, label=label)

plt.legend(loc='upper left')
plt.xlabel('Boosting Iterations')
plt.ylabel('Test Set Deviance')

plt.show()
脚本的总运行时间:(0分27.859秒)
Download Python source code:plot_gradient_boosting_regularization.py
Download Jupyter notebook:plot_gradient_boosting_regularization.ipynb

